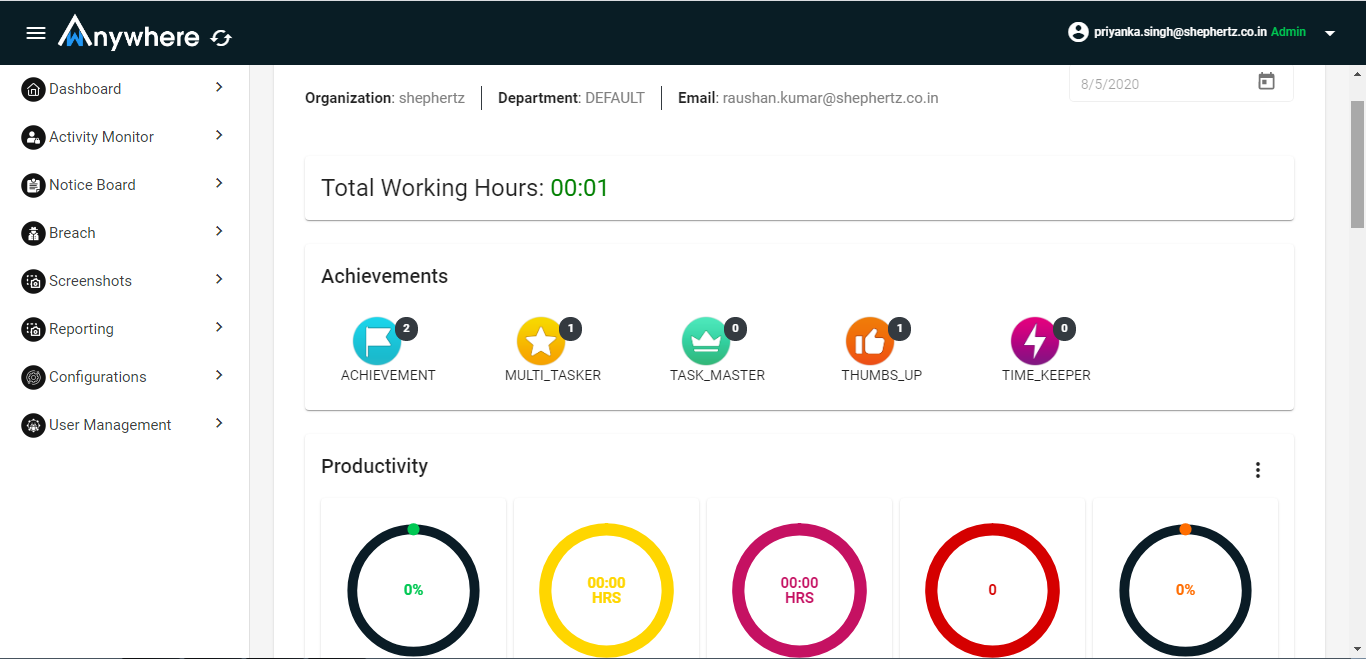
The wAnywhere Dashboard is part of the web console. This document describes the dashboards which are visible as soon as the user logins in through the Manager, Audit, Admin or Super Admin role.
Similar dashboard is available as an individual logs in through the Agent role i.e. as a team member.
The Main dashboard has all the macro level summary about the users productivity, violations and tasks. To get detailed analytics on productivity, violations and tasks the user can refer corresponding dashboards. Drill down reports can be viewed by clicking on the individual dashboards.
The user can select the desired Organization and Department through the selection boxes provided at the top of the dash board and the dashboard will fetch the data respectively.
The below sections illustrate each section of the dashboard in detail:
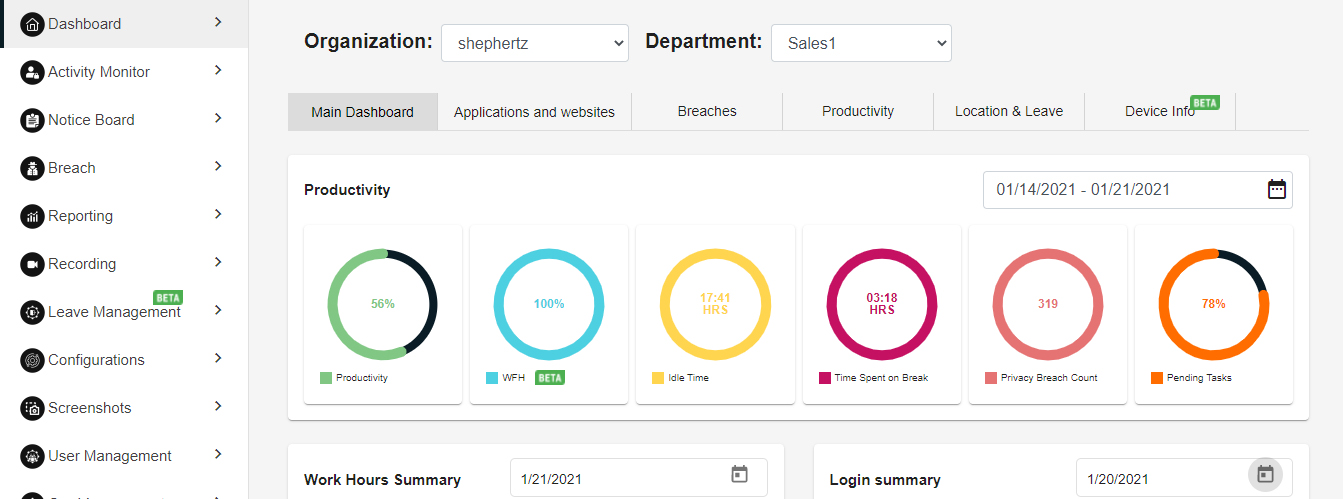
PRODUCTIVITY
This section depicts the productivity metrics at a macro level across a particular department in an organization. The doughnut charts shows visualization for the following metrics.
- Productivity : Macro level productive across all users. By default the productivity is calculated using the following formulae – Productivity Percentage = (Total work hours – (idle time + break time +session logoff time) * 100) / Total work hours. This can be customized to Result based productivity based on Tasks or Application usage e.g. SAP, MS Excel, Power Point, CRM, Incident Management tool etc.
- WFA – Work from Anywhere Metrics
- Idle Time: Total idle time of all users.
- Time Spent on Break: Total time spent on break by all users.
- Privacy Breach Count: Total count of breaches/violation done by all users.
- Pending Task: Task level productivity across all users. By default pending task is calculated using the following formulae – Pending Task= ((100 * (Pending tasks / Total tasks))
Please refer below Productivity image for the reference.
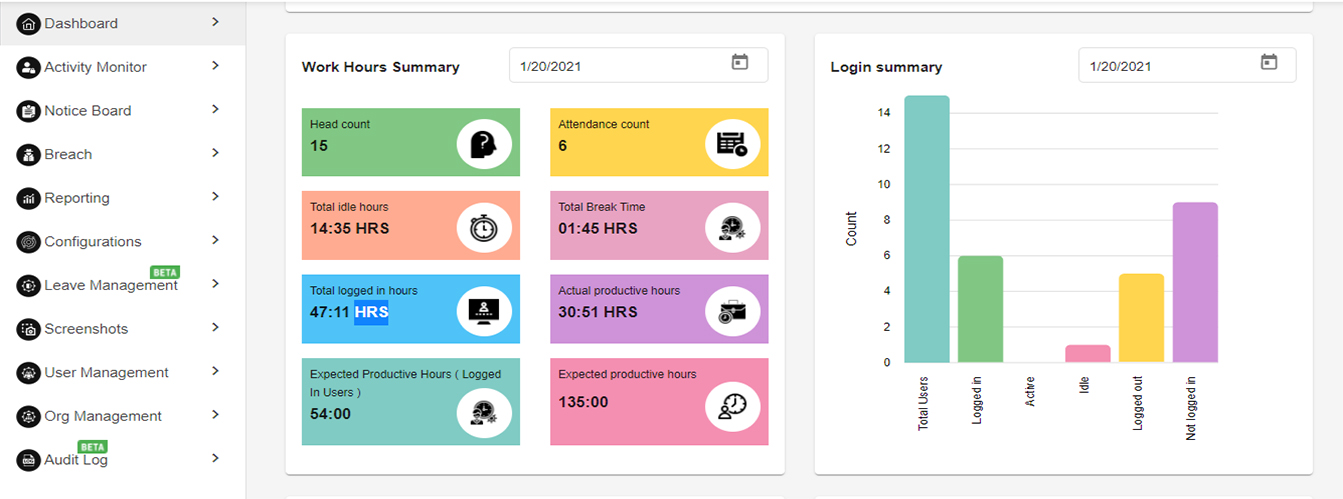
WORK HOUR SUMMARY & LOGIN HOUR SUMMARY
This section has details about the users work hours and attendance. The section is divided into two categories.
1. Work Hours Summary: The work hour summary shows the following parameters:
- Head count : Total no. of users.
- Attendance count : No. of users who have logged in for that day.
- Total idle hours : Total idle time by all users.
- Total logged in hours : Total logged in hours by all users.
- Expected productive hours : Expected productive hours across all users. It is calculated using the following formulae –
- Expected productive hours = No. of Total Users * Working Hours Duration (defined under configuration)
- Actual productive hours : Actual productive hours across all users. it is calculated using the following formulae –
- Actual productive= Total logged in hours – (Total Idle Time + Total Break Time + session logoff time)
2. Login Summary : Login summary shows the following parameters:
- Total users: Total no. of users
- Logged in: Total no. of logged in users.
- Active: Total no. of active users (performing mouse and keyboard)
- Idle: Total no. of users Idle on the system (i.e. not performing any mouse and keyboard activity)
- Logged out: Total no. of users logged out for the day from the agent application.
- Not logged in: Total no of users not logged into the agent application.
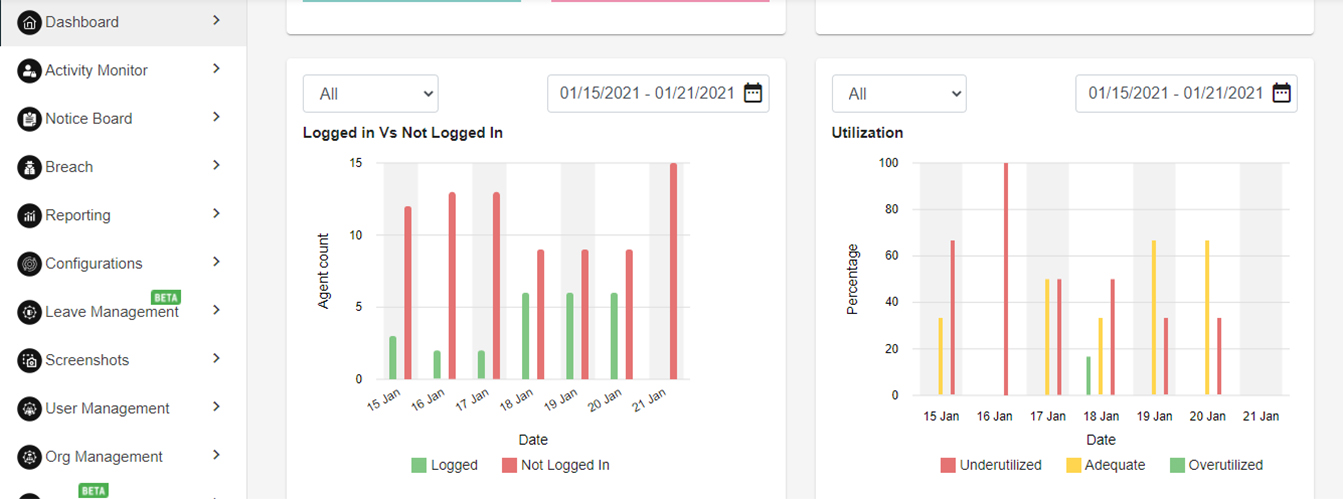
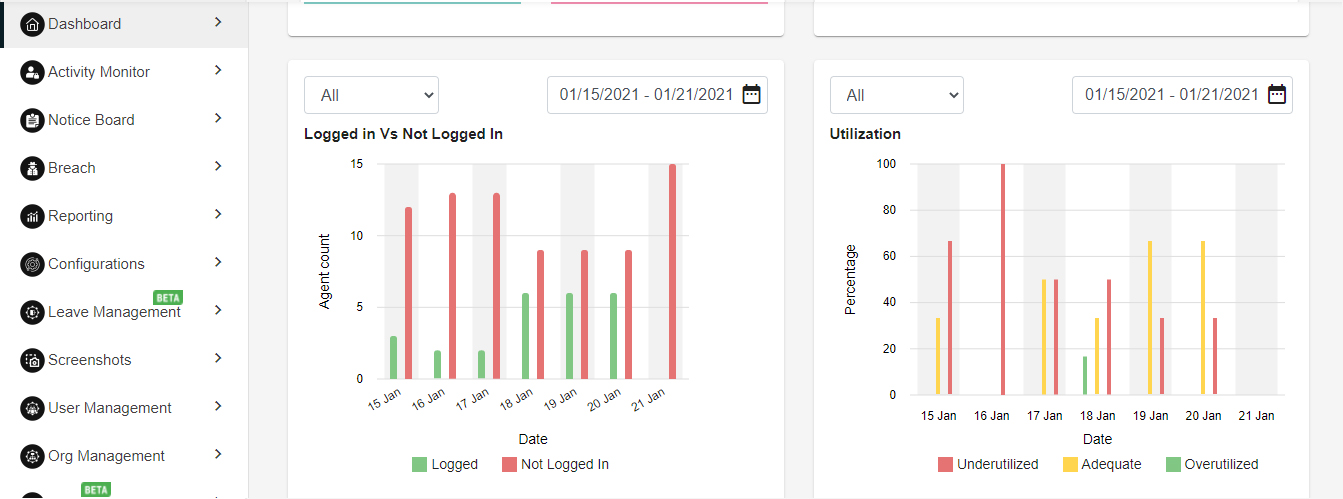
LOGGED IN VS NOT LOGGED IN & UTILIZATION
This section has details about the users attendance and their utilization. The section is divided into two categories.
- Logged in Vs Not logged in: This graph depicts the analytics of logged Vs not logged in users. Data can be filtered by logged users, not logged in users, All and date range.
- Utilization: This graph depict the users utilization. There are three type:
- Underutilized : Users whose work hours below are less than -30mins of configured Working hour duration. The fall in the category of underutilized. e.g. if working hour duration is configured for 9 hours. All users who have completed work hours <8:30 will fall in this category.
- Adequate : Users which are in the range of +30mins and -30mins of the configured working hour duration fall under the category of Adequate utilization e.g. if working hour duration is configured for 9 hours. All users who have completed work hours between >8:30 hrs and <9:30 hrs will fall in this category.
- Overutilized : Users whose work hours exceed +30mins more than the configured Working hour duration. They fall in the category of Overutilized. e.g. if working hour duration is configured for 9 hours. All users who have completed work hours >9:30 will fall in this category.
Please refer below Logged in Vs Not logged in and utilization image for the reference
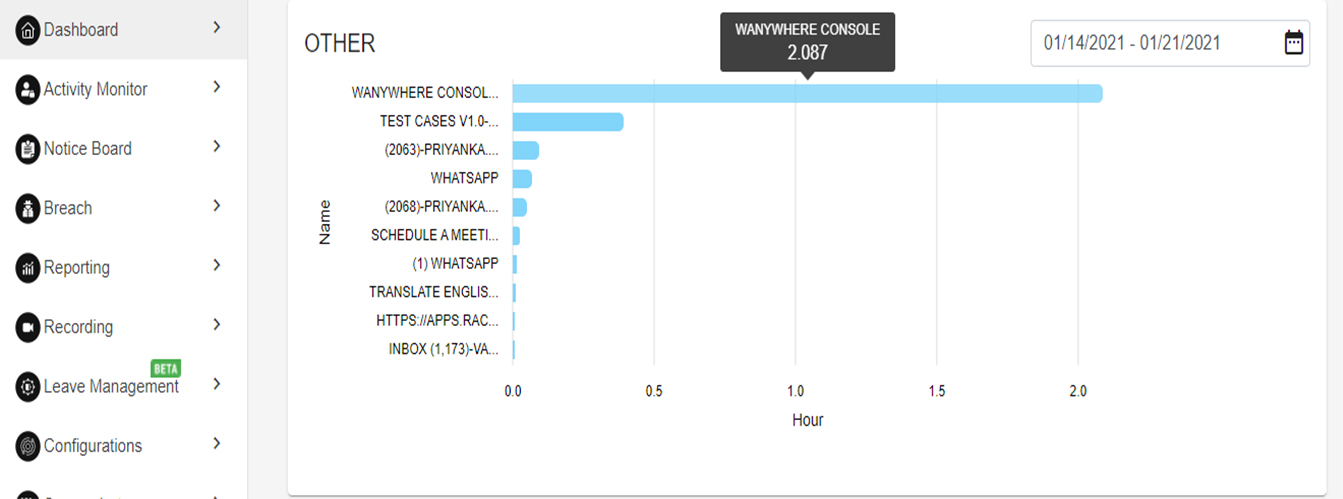
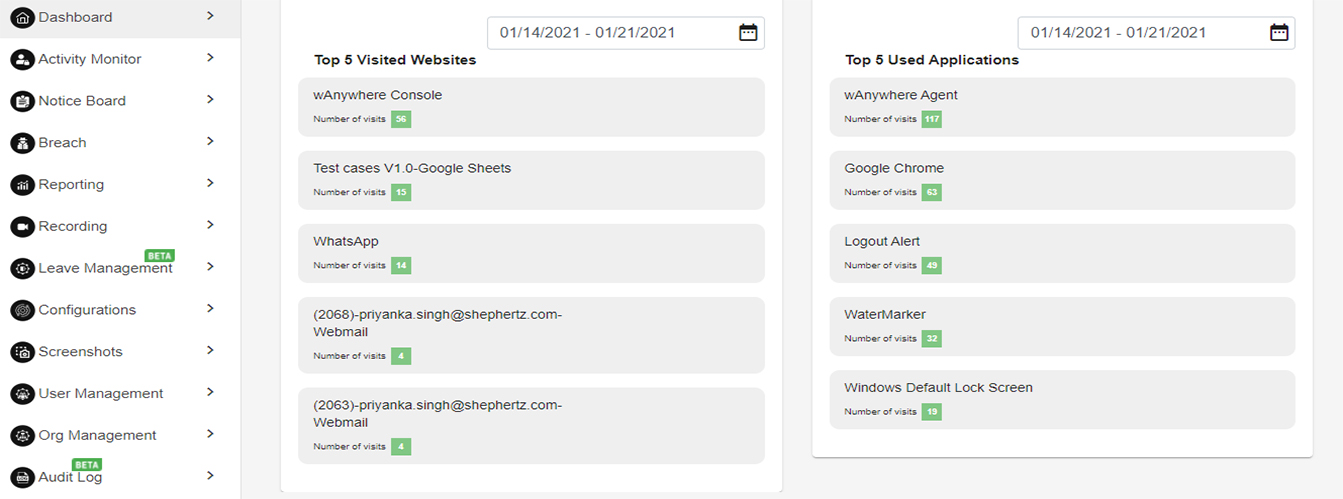
This dashboard shows the analytics of the time spent on the different applications & websites and top 5 used applications and visited websites. (Refer Image No. 4 & 5)
Also, it shows the usage in terms of percentage of productive and non-productive application and websites. Which applications/websites are productive or non-productive and which applications/websites are authorized or not authorized can be configured.
The Breaches/Violations dashboard has macro level summary about the users breaches/violations.
The user can select the desired Organization and Department through the selection boxes provided at the top of the dash board and the dashboard will fetch the data respectively.
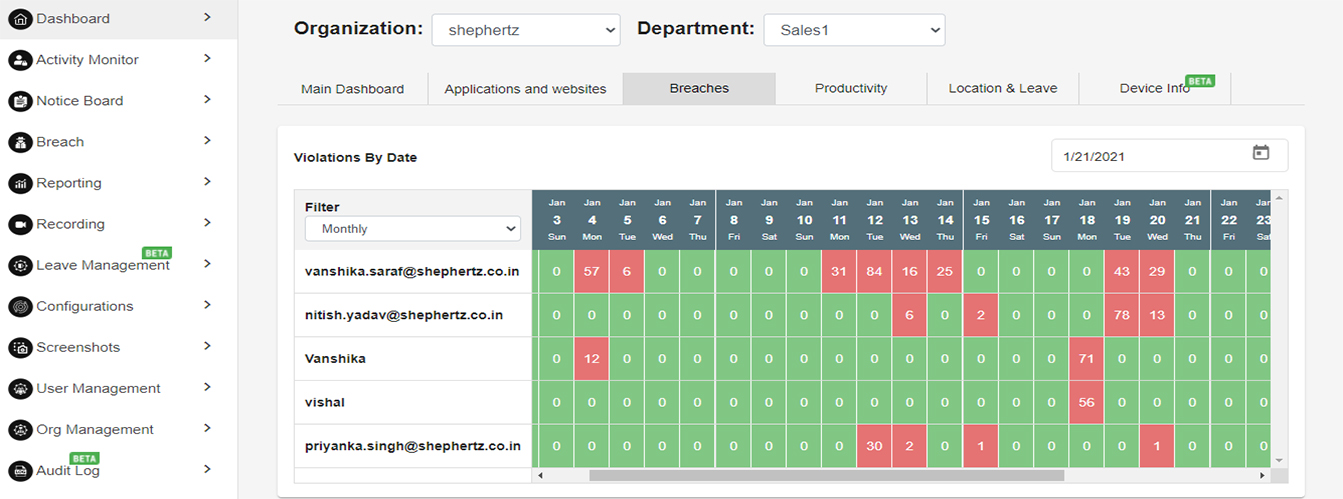
VIOLATIONS BY DATE
This dashboard depicts the date-wise breach/violation records across all the users in descending order.
Data can be viewed monthly or weekly.
Refer the below image which shows the violation by date dashboard.
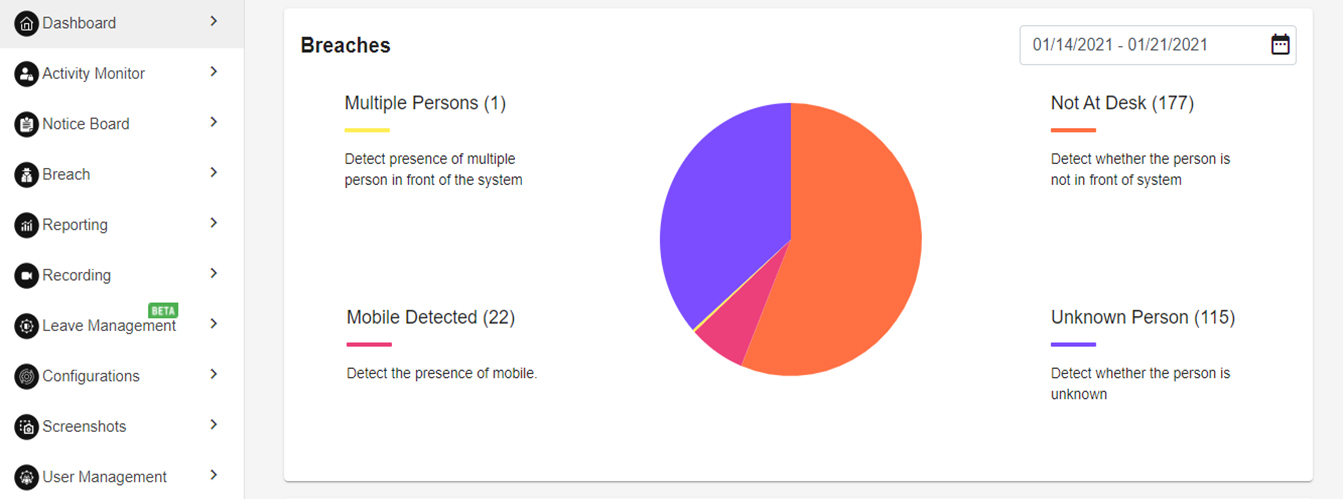
BREACHES
This dashboard depicts the total breach/violation distribution in a pie chart format. Date range is configurable through the date picker.
Refer the below Breaches/violations pie chart.
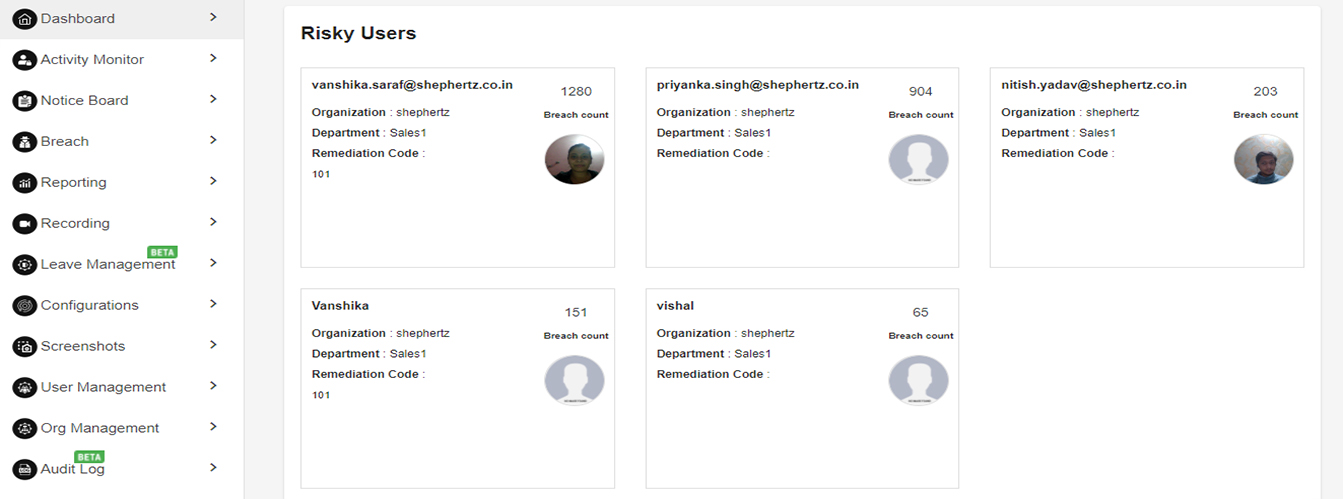
RISKY USERS
This dashboard depicts the list of users who have exceeded their breach/violation threshold above the configured threshold. This enables to monitor users which are repeat offenders.
Refer the below dashboard for risky users. The list is sorted in a descending order, in which the users who have the highest no. of violations are shown at the top.
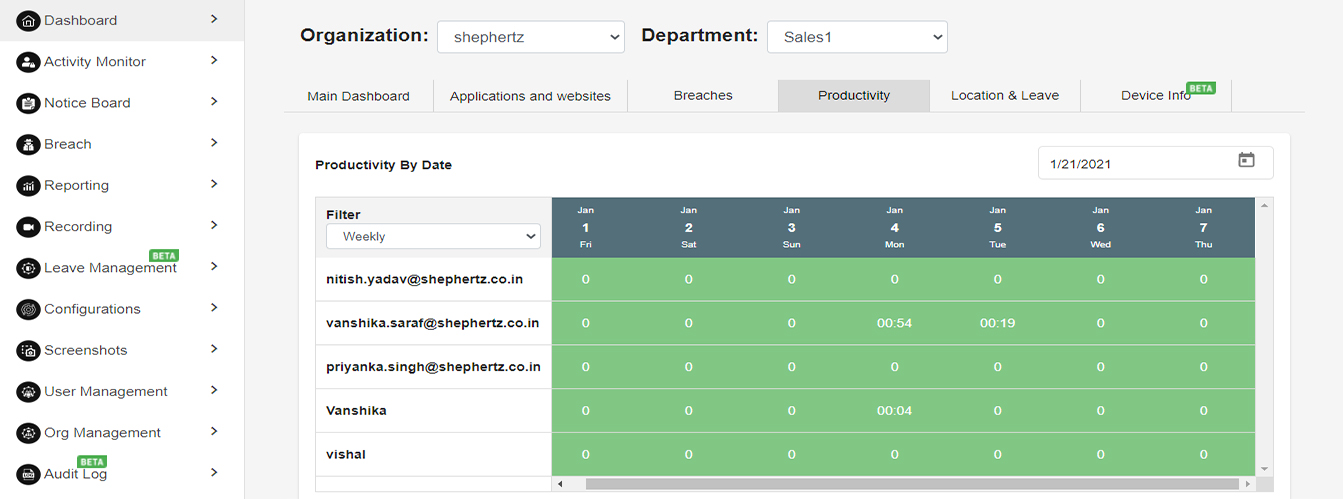
The Productivity dashboard shows the total login hours of multiple users across dates ( Monthly/Weekly)
PRODUCTIVITY BY DATE
This dashboard depicts the date-wise total work hour duration records across all the users in descending order in a tabular format.
Data can be viewed monthly or weekly.
Refer the below tabular image which shows the users total work hours for a week.
AVG. LOGGED IN HOURS VS IDLE TIME & TIME SPENT ON BREAKS
The section is divided into two categories.
1. Avg. logged hours Vs Idle time: This graph shows the Avg Logged in vs Idle time analytics. The user can see data by selecting the desired date range in a bar chart format.
2. Time Spent on Breaks: This graph shows the total time spent across all users in line char format. Please refer below Avg Logged in hours Vs Idle time & Time spent on Breaks graph image for the reference.
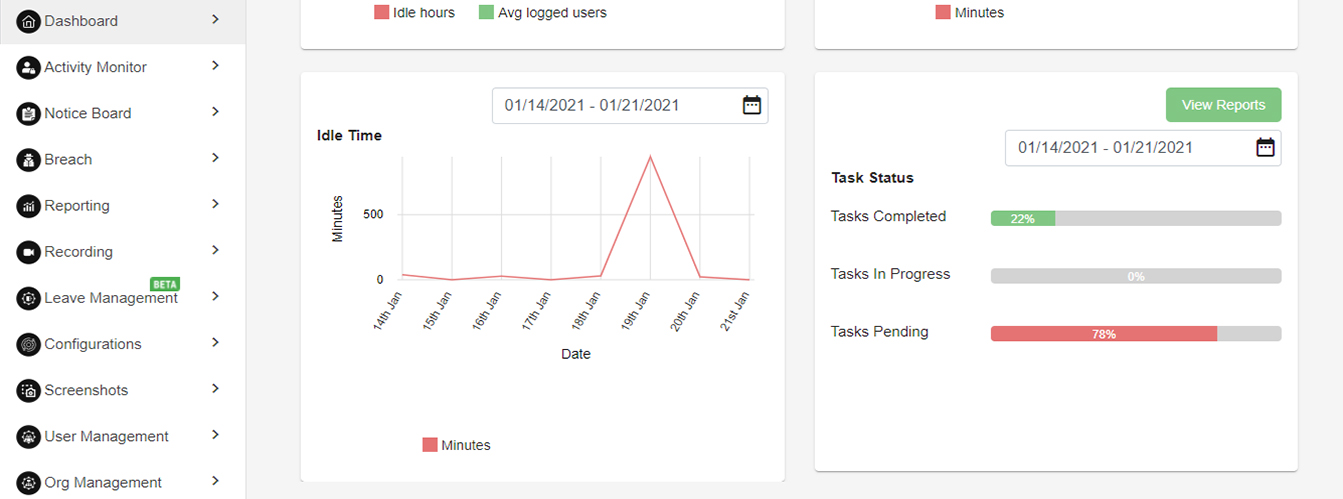
IDLE TIME & TASK STATUS
The section is divided into two categories. The user can select the desired date range.
1. Idle time: This line chart shows the total idle time for all users.
2. Tasks Status: This progress bar chart shows the total tasks status in percentage i.e. Tasks completed, Tasks in Progress and Tasks Pending.
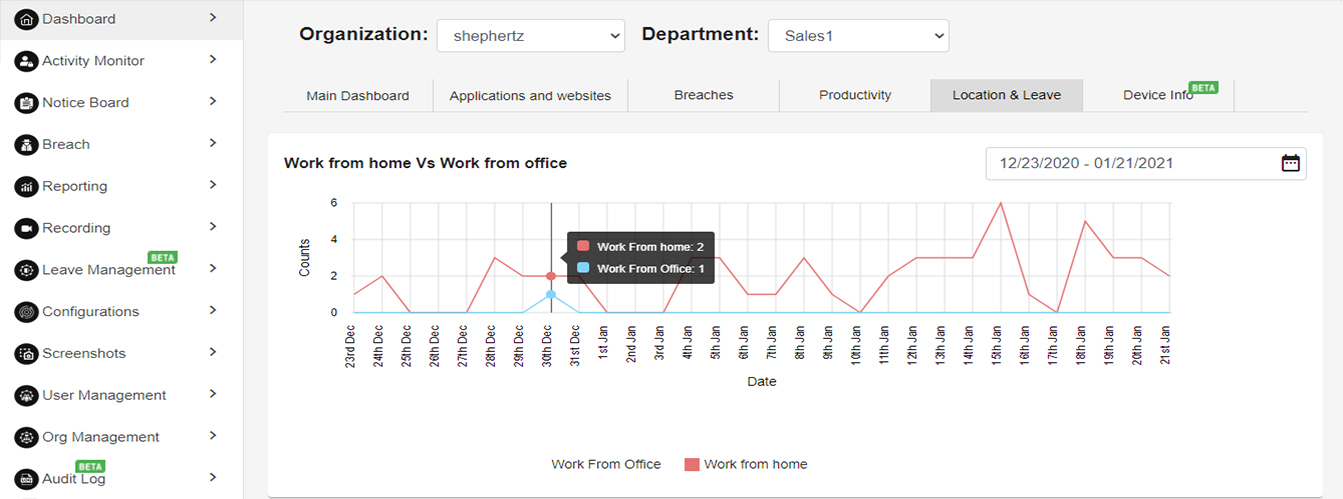
This section divided into two category. The two charts shows the users segregation of how many users are working from home and how many are working from office. The second line chart shows the no. of users who are on leave.
WORK FROM HOME VS WORK FROM OFFICE
The below line chart shows the work from home vs work from office analytics. Desired date range can be selected.
Refer the below chart for Work from home Vs work from office analytics.
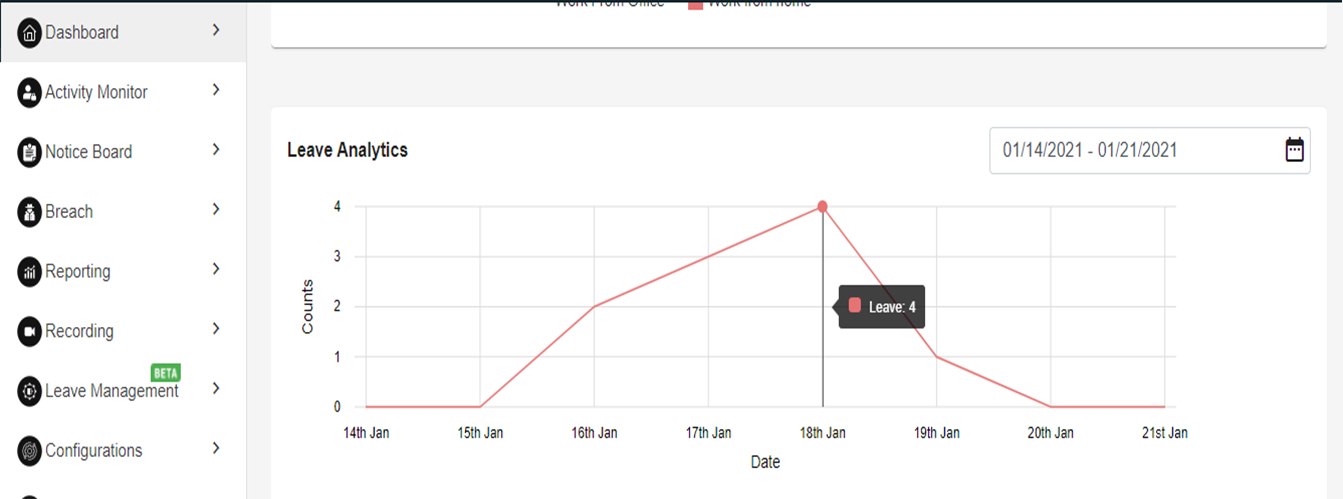
LEAVE ANALYTICS
The below line chart shows the leave count across all users for the selected date range.
Refer the below line chart for Leave Analytics.
The Reports section has multiple reports in excel formats. Reports can be fetched for the desired date range and time zone. Below is the list of all reports provided out of the box:
- Privacy breach/violation summary
- Privacy breach/violation detailed
- Breach audit tracking
- Activities website
- Activities app report
- Users activity summary
- Users not logged in
- Non-Compliant
- Work from home and office analytics
- Leave tracking
- Idle Time: Idle time is the total inactivity of the user i.e. either keyboard and mouse when the users when the users machine is on and is logged in the wAnywhere system.
- Break Time: Break time is total time spent on breaks. Breaks can be taken by the user by clicking on the ‘Break’ button on the agent. If the configured break threshold is exceeded then it is visible to the user as well his manager. If notification is enable a mail is also tiggered to the manager.
- Login hours: Total hours the user has logged into the wAnywhere solution. i.e. The time from which the user has logged in and the logged out using the ‘log out for the day’ option
- Session log off: Apart from breaks the user can during the day log off from the session and then session log in again. If the user has logged off for the session, it’s still not considered that the user has logged in for the day.
- breach/violation: Any violation recorded by the system e.g. Not At Desk, Multiple Persons, Mobile Detection, Digit Copy detection.
- Work from Home/Work from Office: The user has the option to select whether the user has logged in to the wAnywhere system from his office or home.
- Leave: Leave taken through the leave section
- Activity: The following activities are recorded
- Last activity: has the user done any keyboard or mouse activity. Noe: The type of key pressed or mouse position is not saved or recorded in any format
- Application: All applications which are opened are recorded along with their duration (If intrusive level is set ‘Medium’ and above).
- Websites: All websites which the user visits are recorded along with their duration (If intrusive level is set ‘Medium’ and above).
- AI Detections: If intrusive levels are set to ‘High’ or AI detections are individually enabled. A camera image is captured and sent to the server for AI Detections based on the configured sync interval.
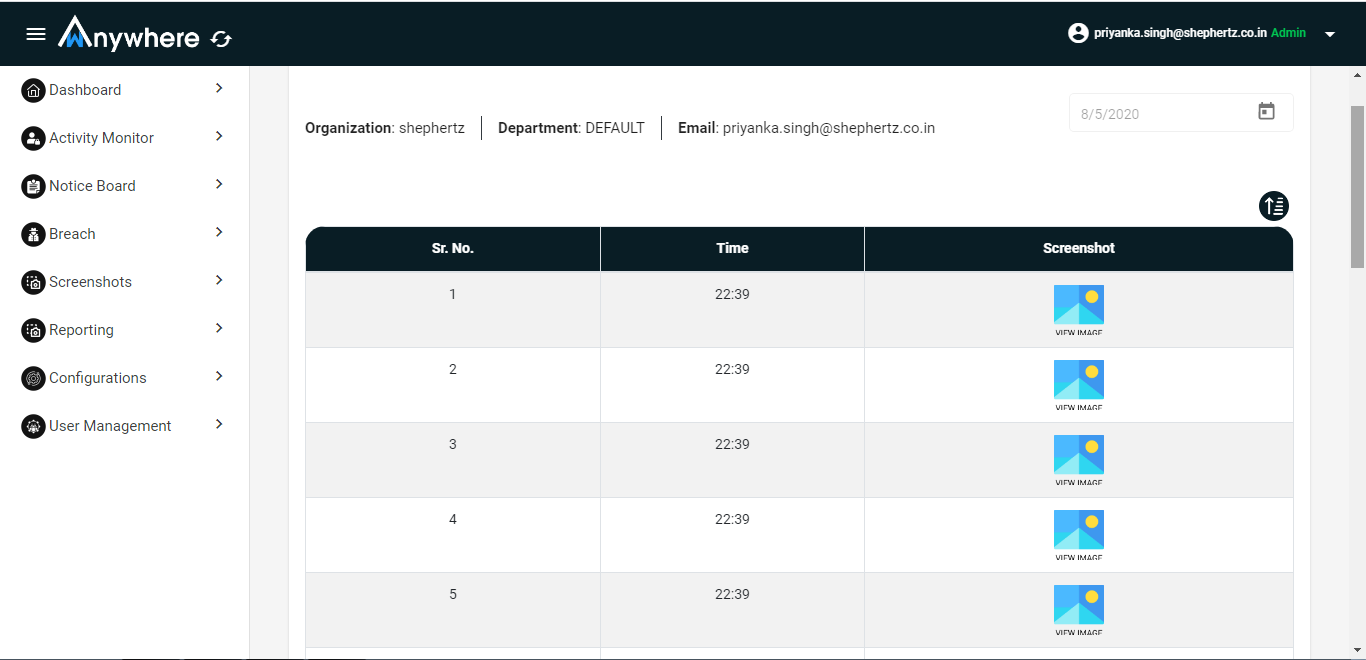
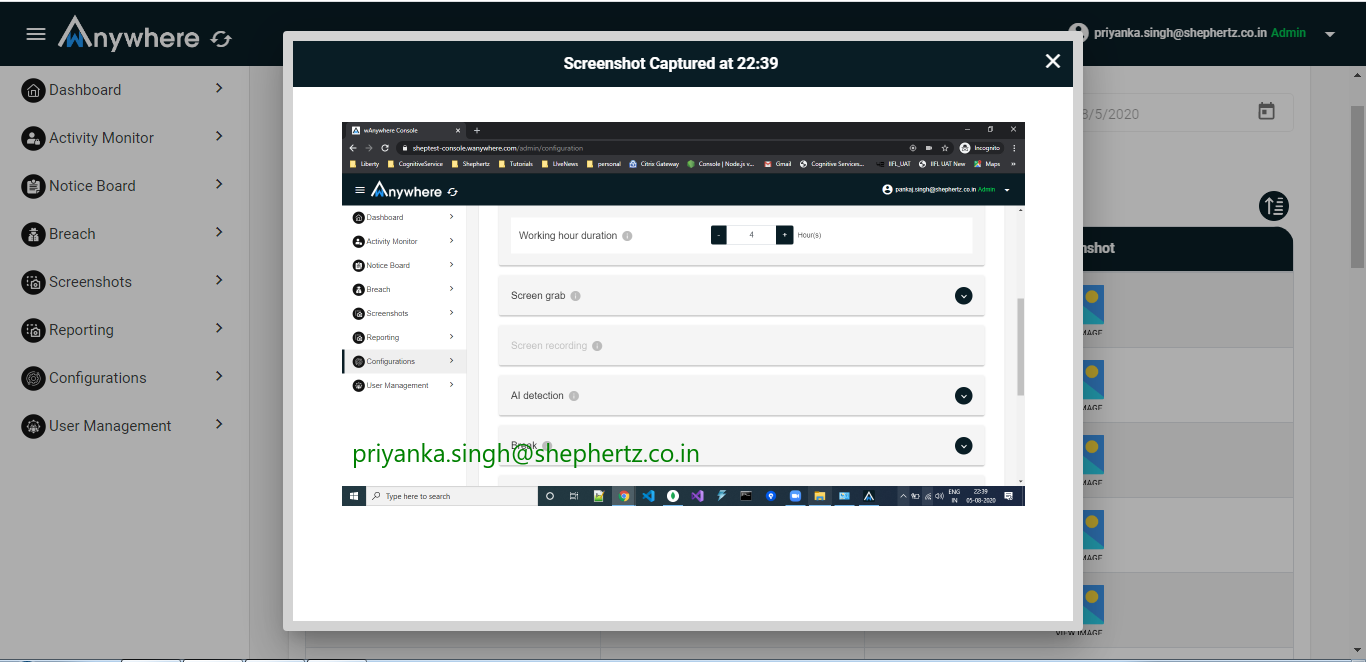
- Screenshot: If screen shot recording is enabled. The screen shot image will be sent to the server for recording based on the configured sync interval.
Sign up with mail id page
- Enter Your email id
- Enter your organisation Name
- Click on sign up button
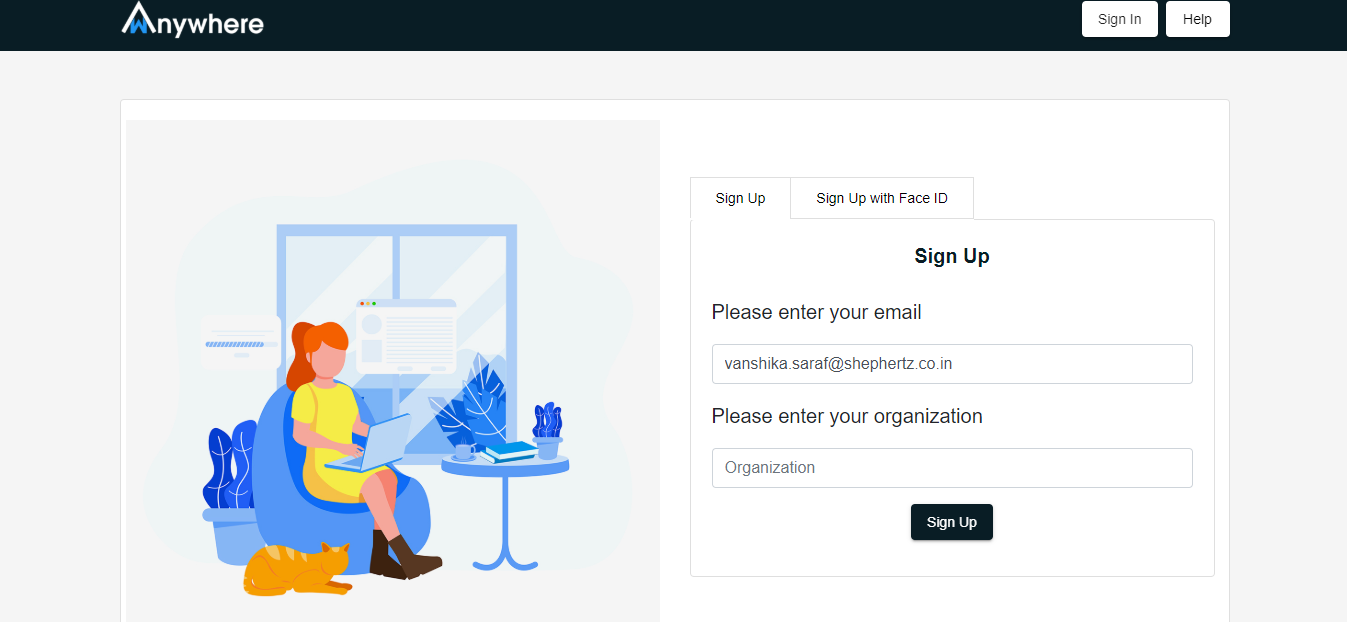
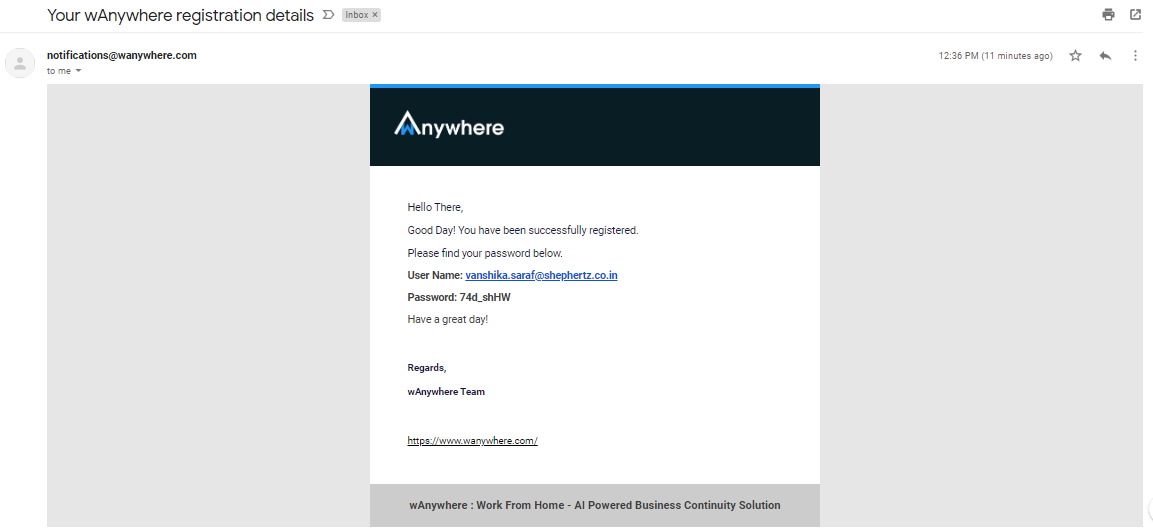
- Email notification will recieved on your registered email id.
- Now login with the recieved credentials
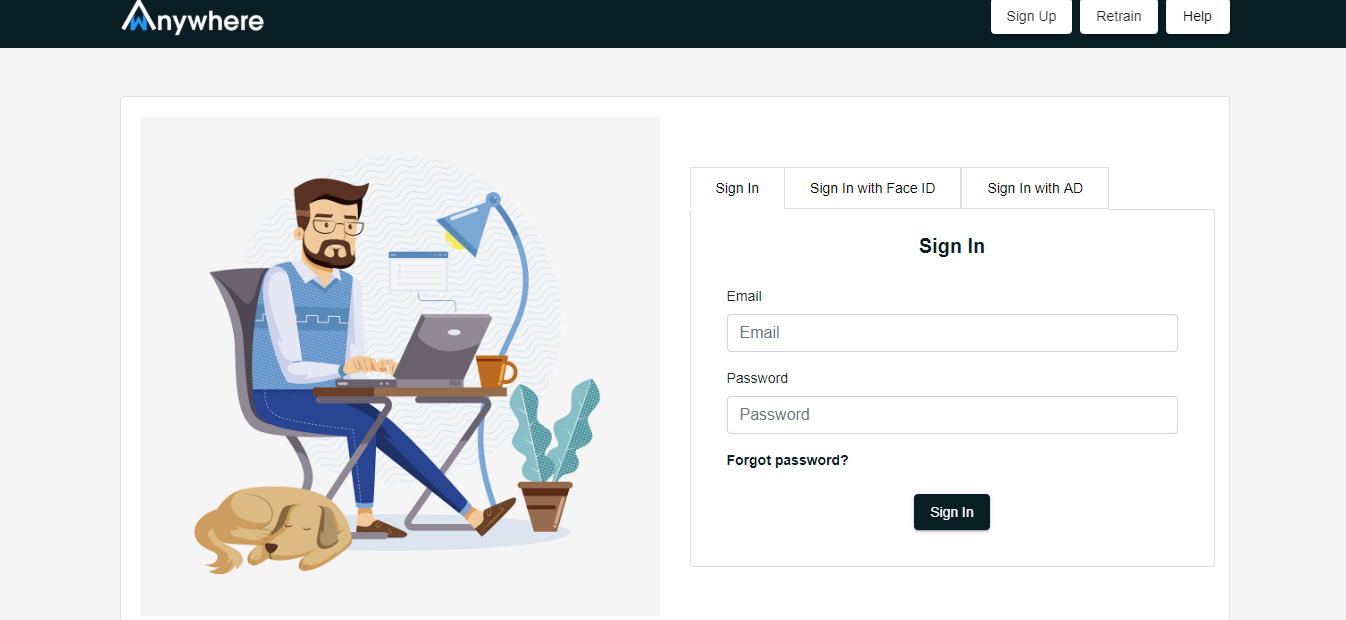
Sign in with mail id
- Enter Your email id
- Enter your password
- Click on sign in button
- You are not approved for login, wait for confirmation
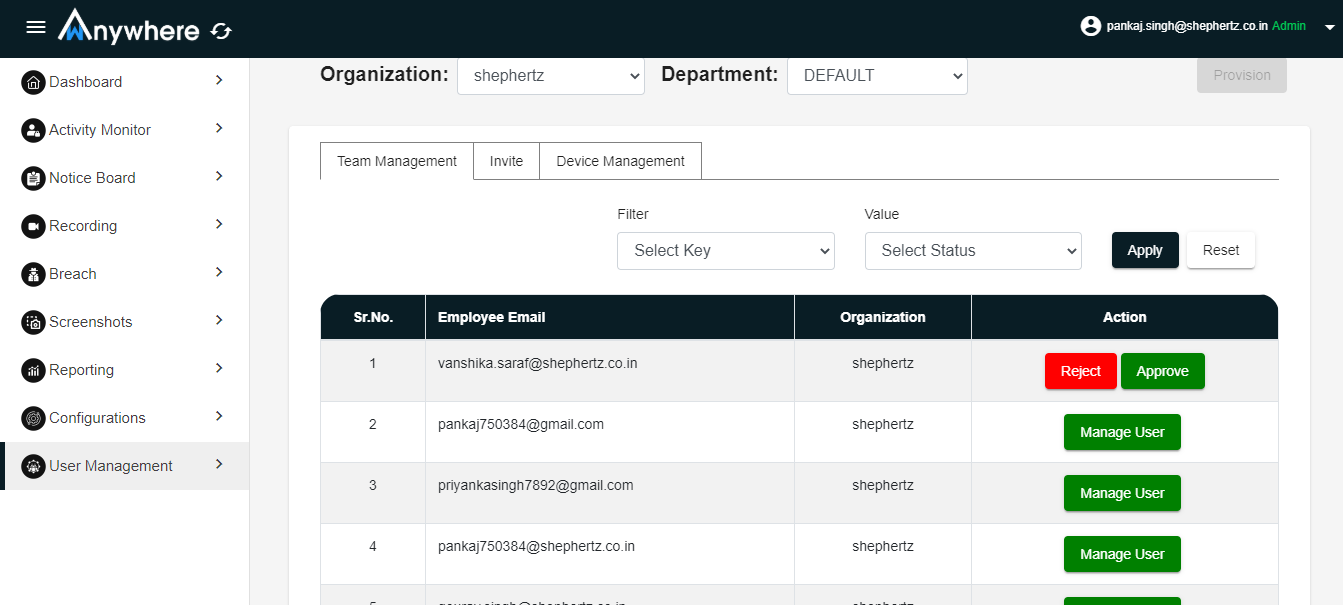
- Login into admin/superadmin console
- Go into user management
- Select user
- Click on approval button
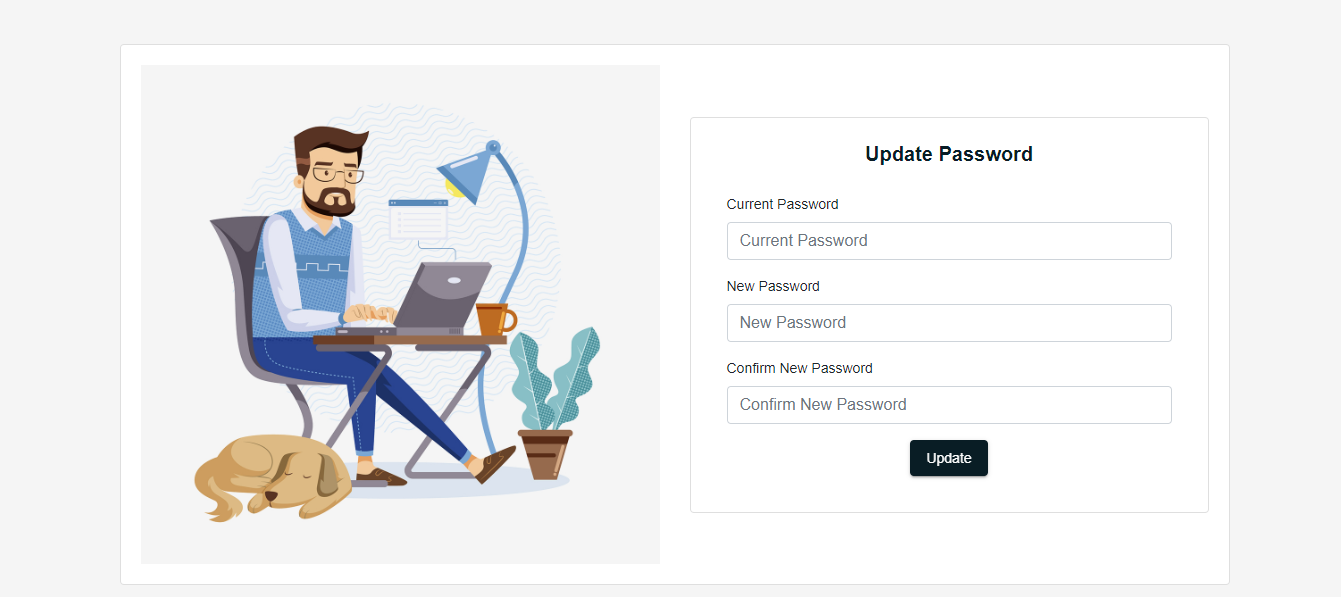
Update password
- Enter current password
- Enter new password
- Click on update button
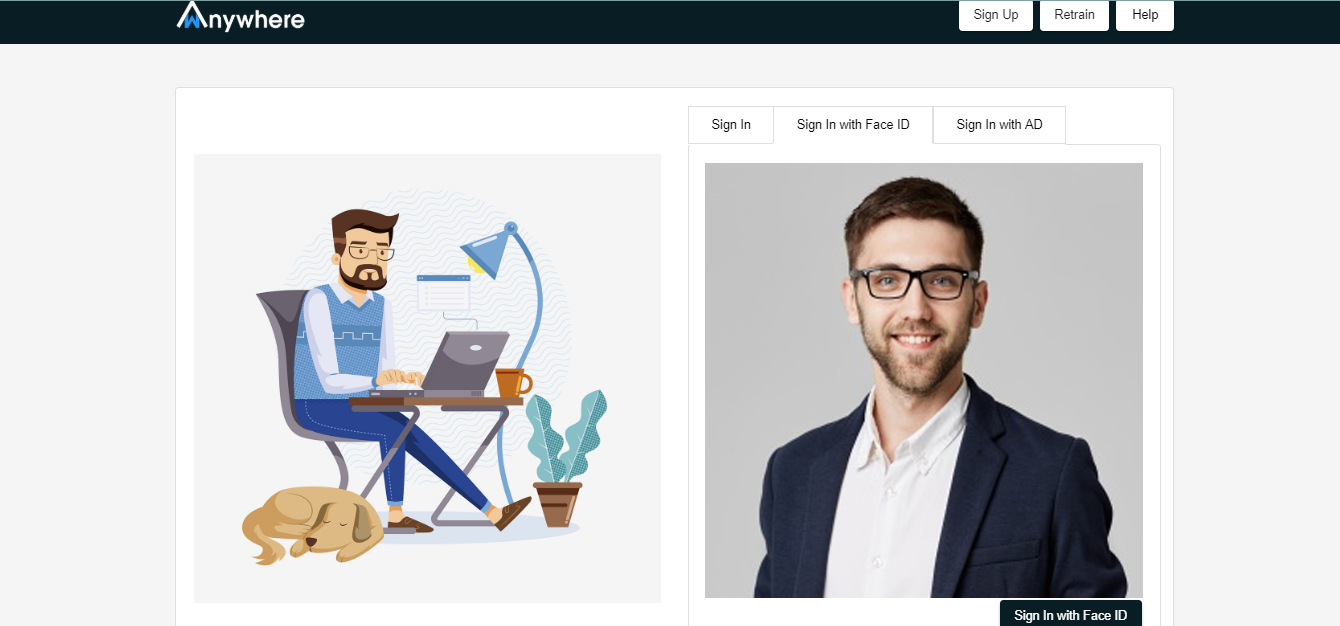
Sign up with face ID
- Enter the email address
- Enter the organization
- Click on sign up with face id button
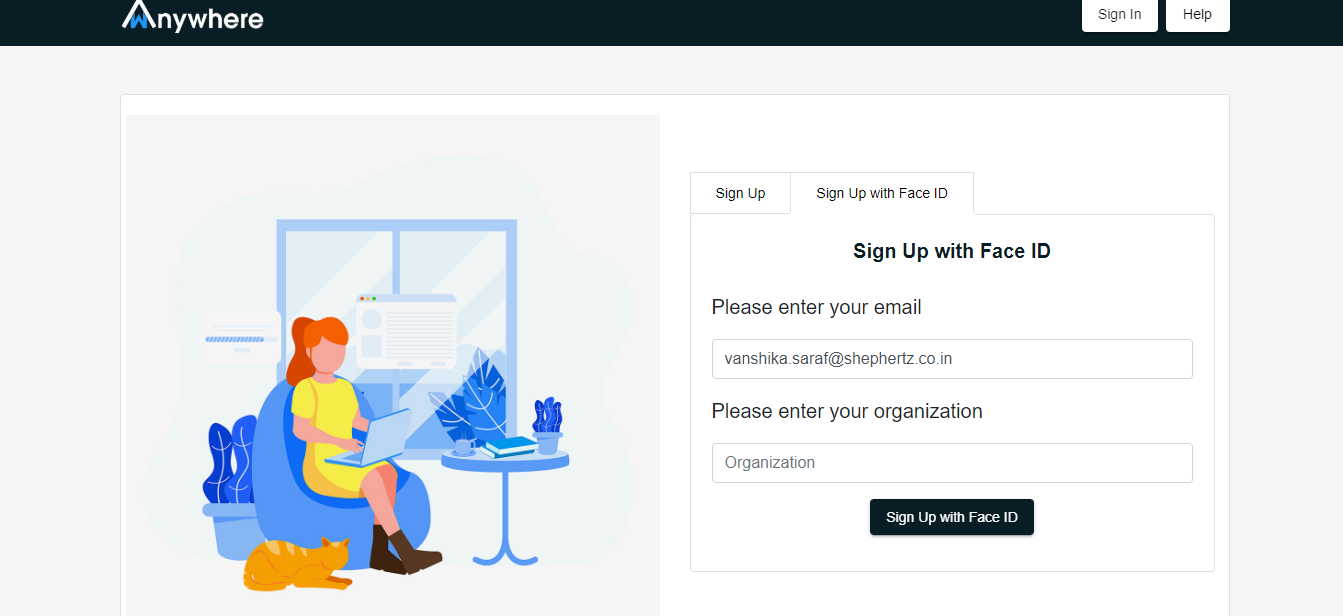
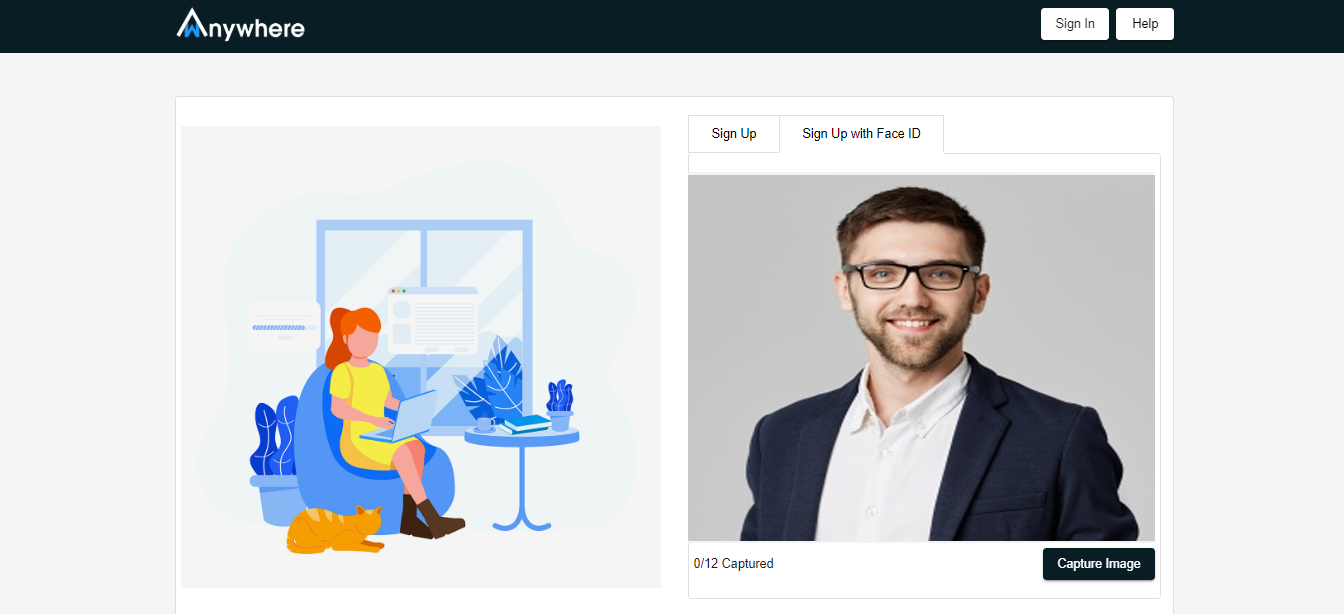
- Camera will opened and capture 12 images
- Registration Successful message will show
- Wait for the admin/superadmin face approval
Sign in with face
- Login into the admin/superadmin console
- Go to the user management and select user
- Click on face approval button
- Click on the face approval checkmark
- Click on update button
The retrain face feature is used to increase the confidence score of the user face.
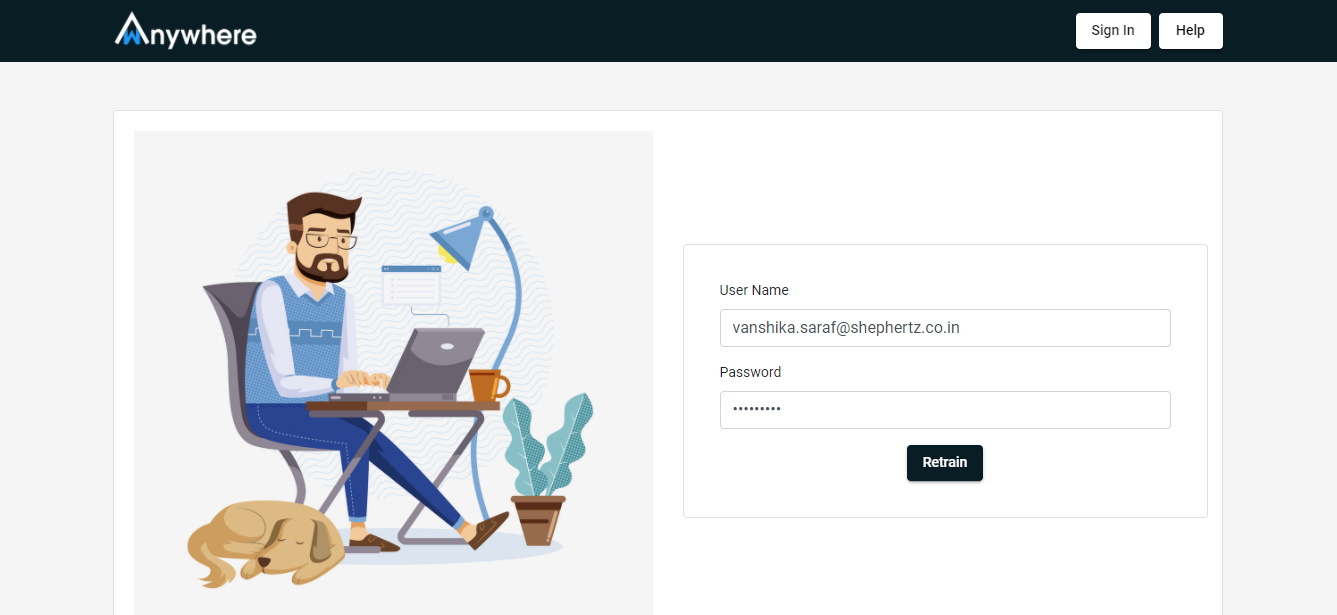
- Retrain the face page
- Enter the email address
- Enter the password
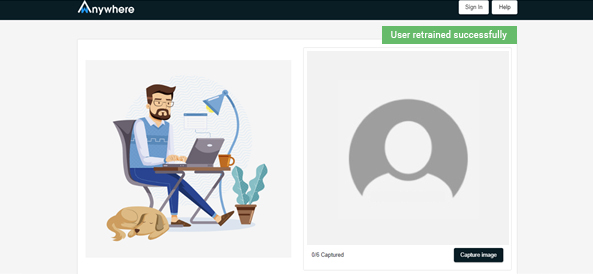
- Capture image to retrain the face
- User retrained successfully
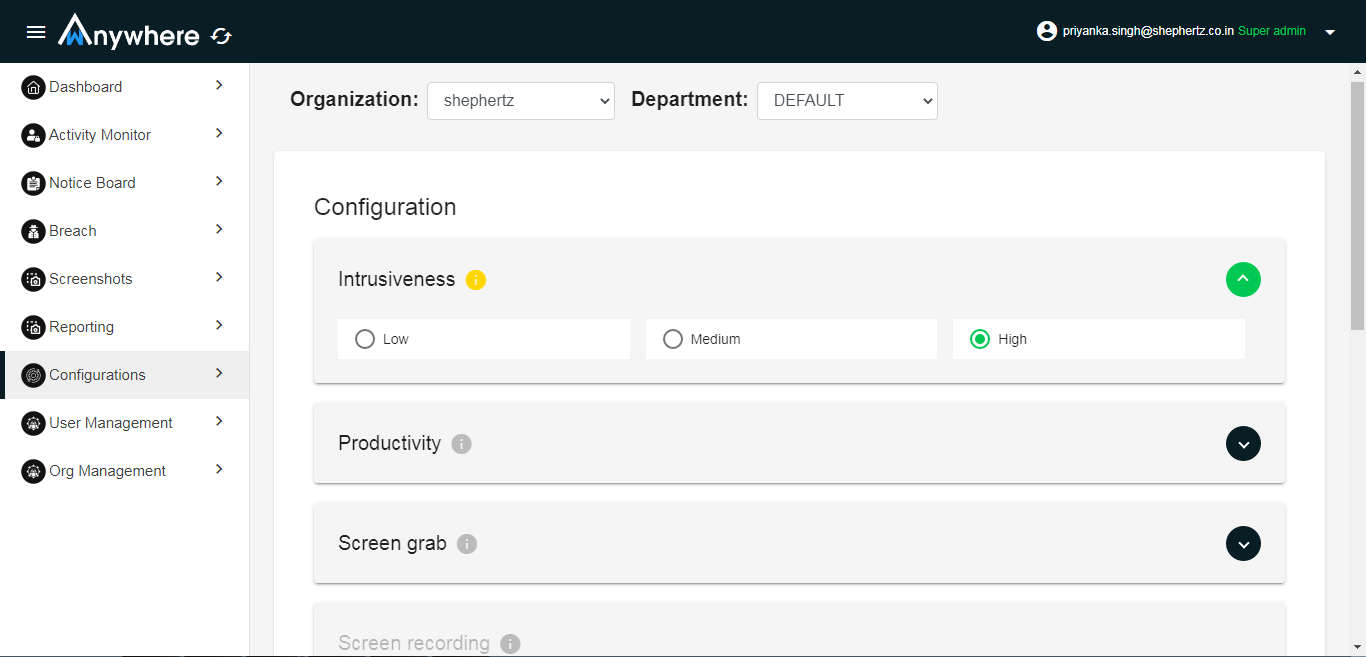
Superadmin and admin can change configuration. Follow below steps.
- Login
- Select configuration
- Select organization and department
- Select Intrusiveness level low/medium/high
- Low- Only Idle time, Medium- Idle time+ website+ application, High-Idle time+ website
- +application +AI activities
- Productivity -set Idle time duration and working hour as per organization policy
- ScreenGrab- set Screenshot capture interval and Image to be saved or not
-
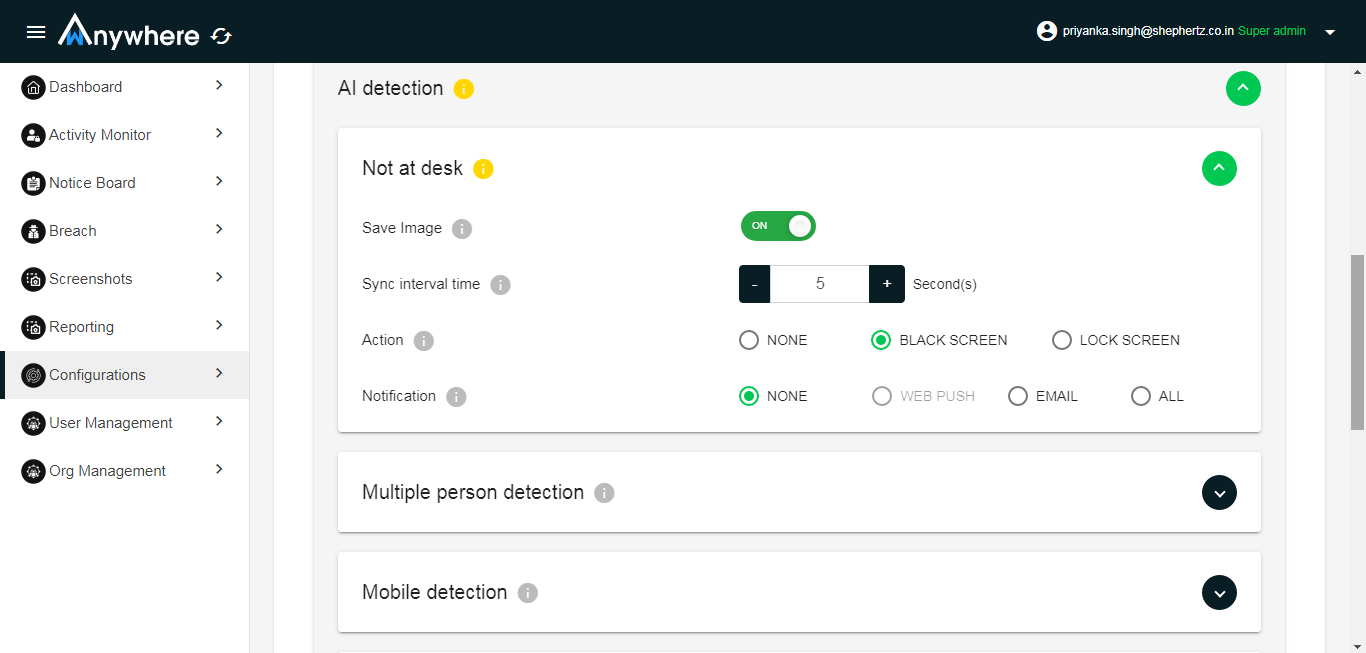
AI Detection (sync interval set in any of the AI activities applicable to all not at desk, mobile as well as multiple except unknow(it’s having separate sync interval setting))
- Not at desk- Image save on/off, Sync interval time, Action black screen or lock screen, notification trigger to manager
- Mobile - Image save on/off, Sync interval time, Action black screen or lock screen, notification trigger to manager
- Multiple - Image save on/off, Sync interval time, Action black screen or lock screen, notification trigger to manager
- Unknown- Image save on/off, Sync interval time, Action black screen or lock screen, notification trigger to manager
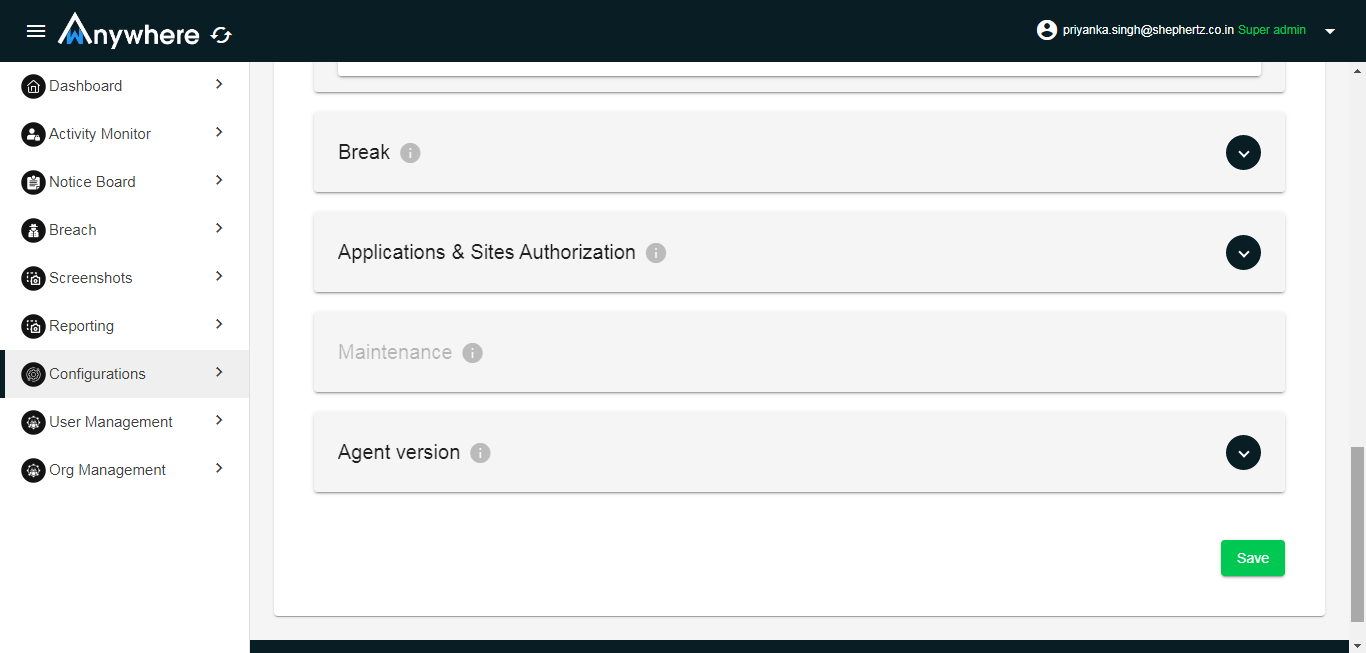
- Break- define number or break allowed in your organization and break time
- Application and site Authorization- Enter authorized site list and Enter unauthorized website list
- Click on save button
- Superadmin, admin, and auditor can see the activity record for selected organization and department.
- Manager can see the activities record for his team members.
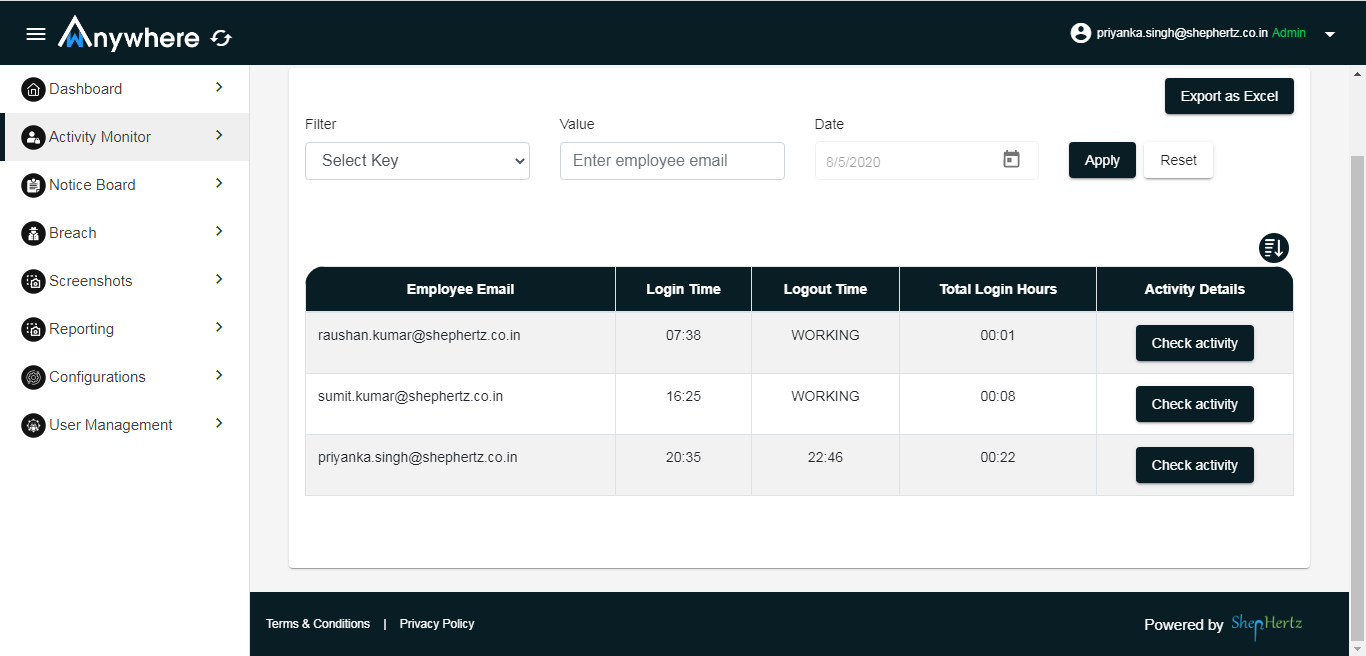
- Login into console
- Select activity monitor menu
- Select date
- Click on apply
- Click on check activity
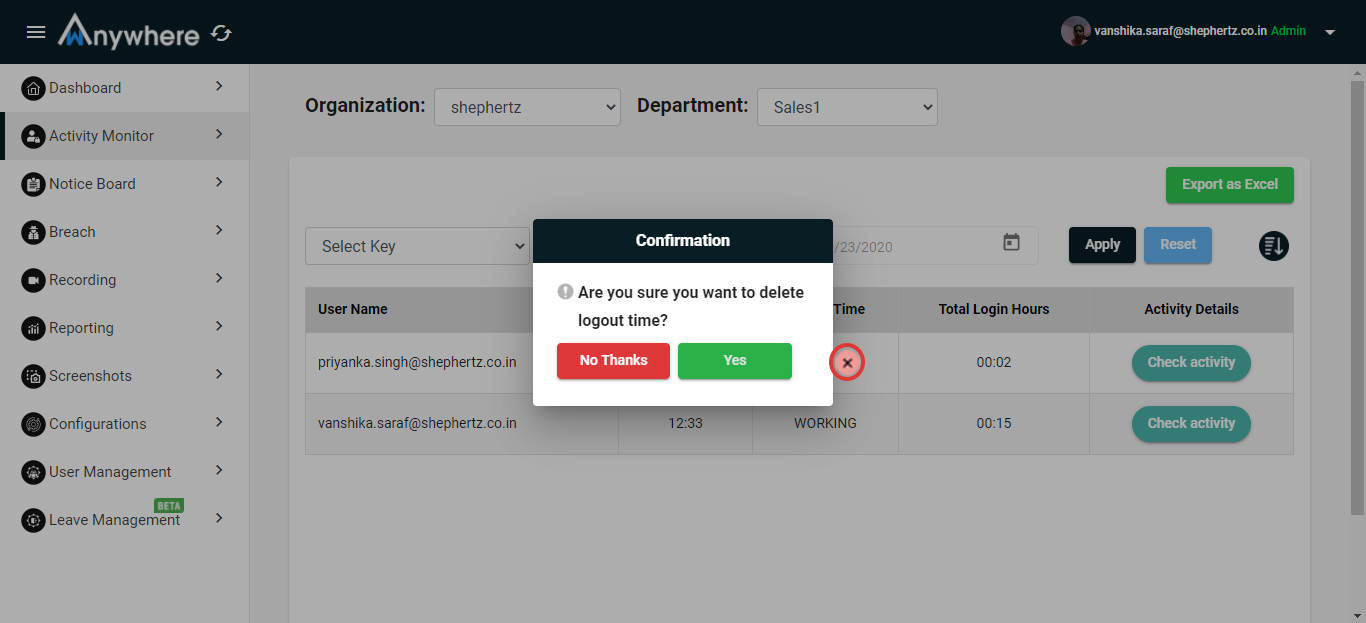
Logout time deletion
- Click on the cross (x) button to delete the logout time.
- Only superadmin, admin and manager can delete the logout time, if the agent mistakenly logged out for the day before the working hour duration.
Superadmin, admin, auditor can see the breach for selected organization and department.
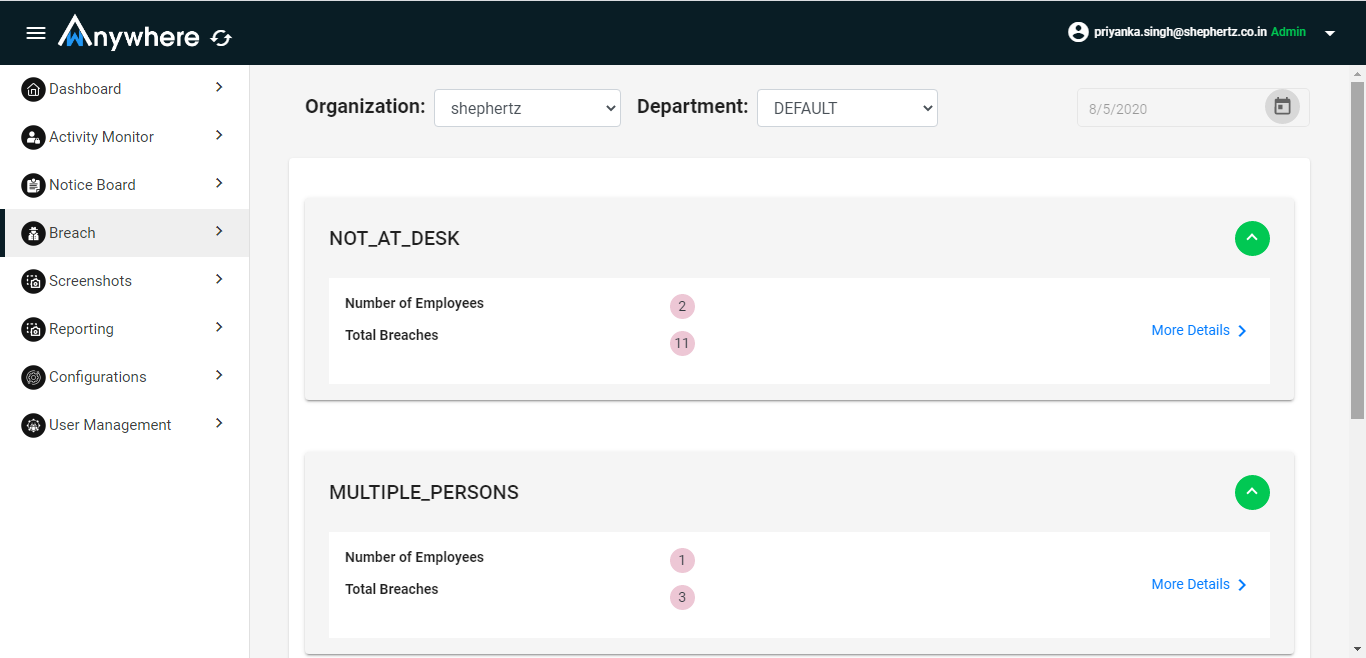
Manager can see the breach for his team member.
- Login
- Click on Breach menu
- Select organization and department
- Select date
- Display list of not at desk, multiple, mobile detection
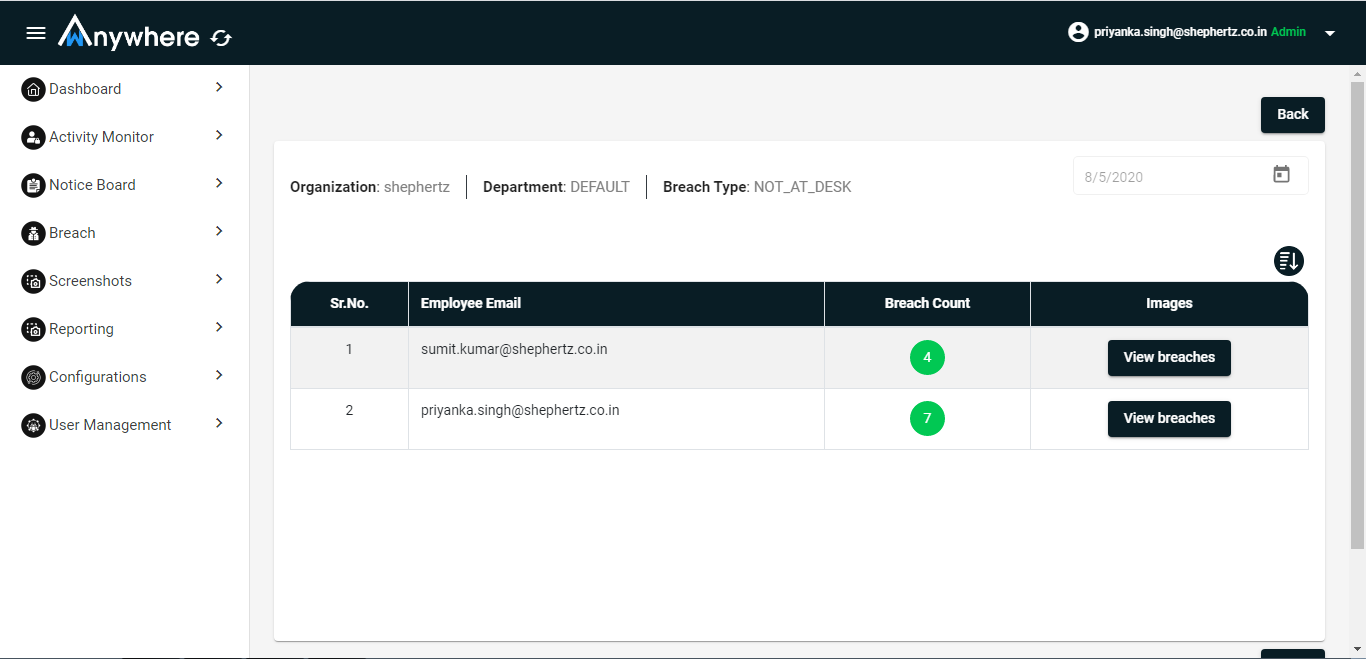
- Click on more detail
- Click on View breach
-
Breach will close after adding the remediation
- Click on add remediation
- Add remediation text
- Click on add button
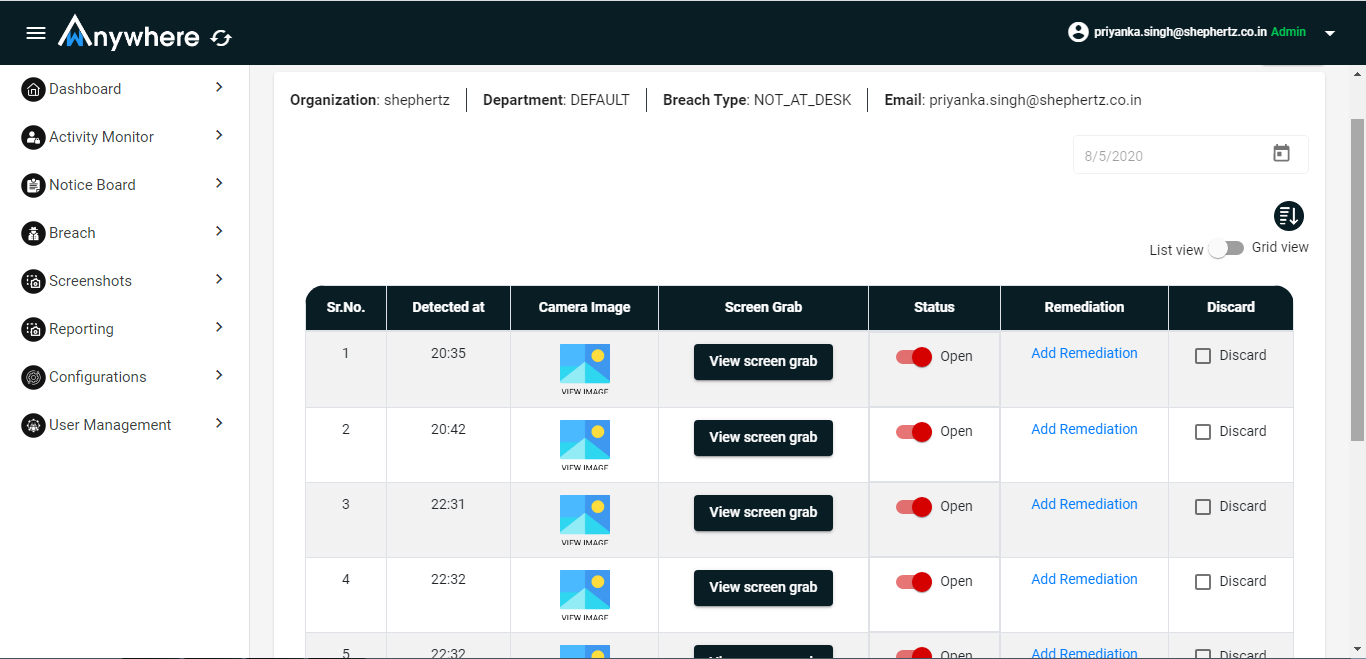
-
Breach can discard
- Check discard check box
- Click on yes button
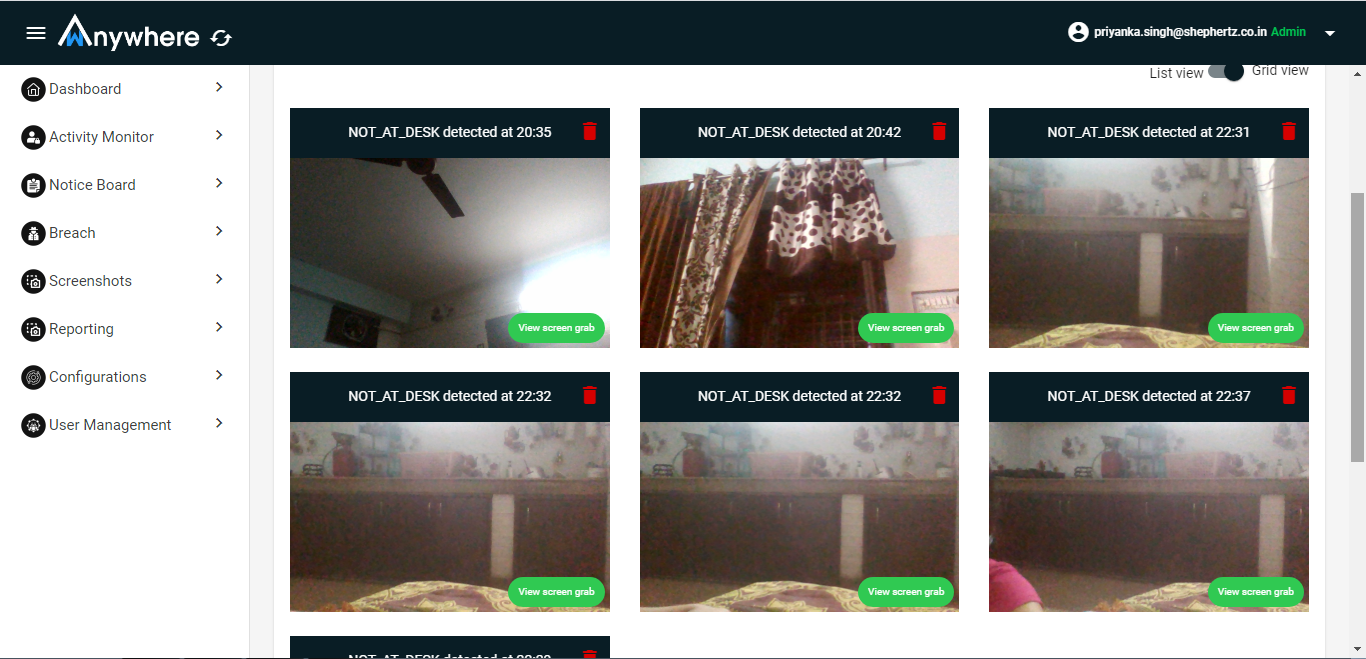
Superadmin, admin, auditor can see the screenshot of agent machine for selected organization and department. Manager can see the screenshot for his team member.
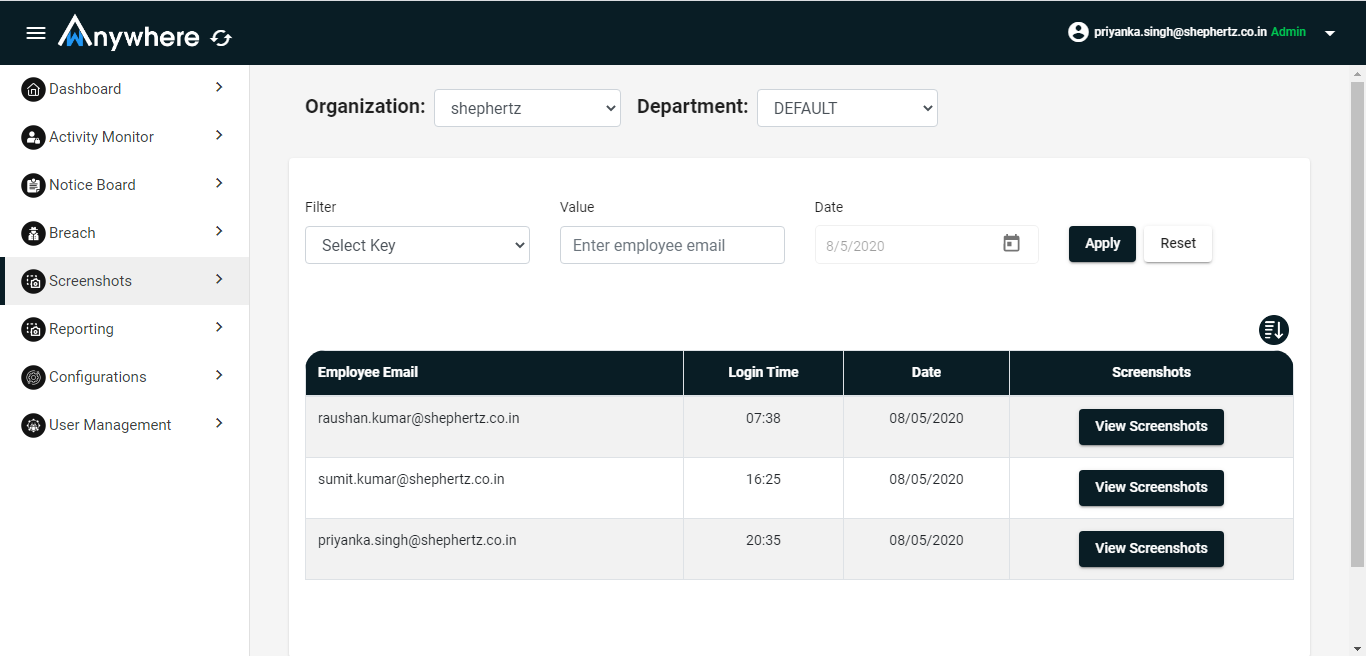
- Login
- Click on screenshot menu
- Select date
- Click on view screenshot
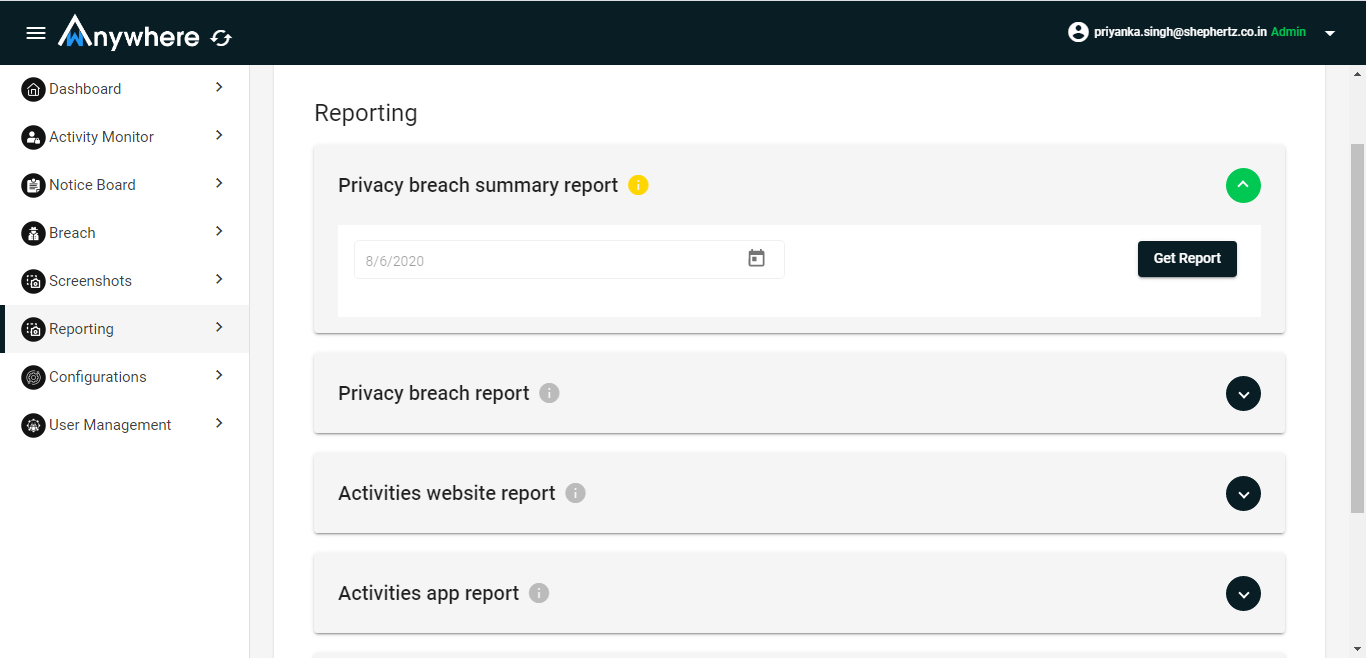
Superadmin, admin and auditor can download the report for a date in the CSV format.
- Login
- Click on reporting menu
- Select date
- Click on get report
Superadmin and admin can manage users.
- Login
- Click on User management menu
- Select Team management tab
- Select user
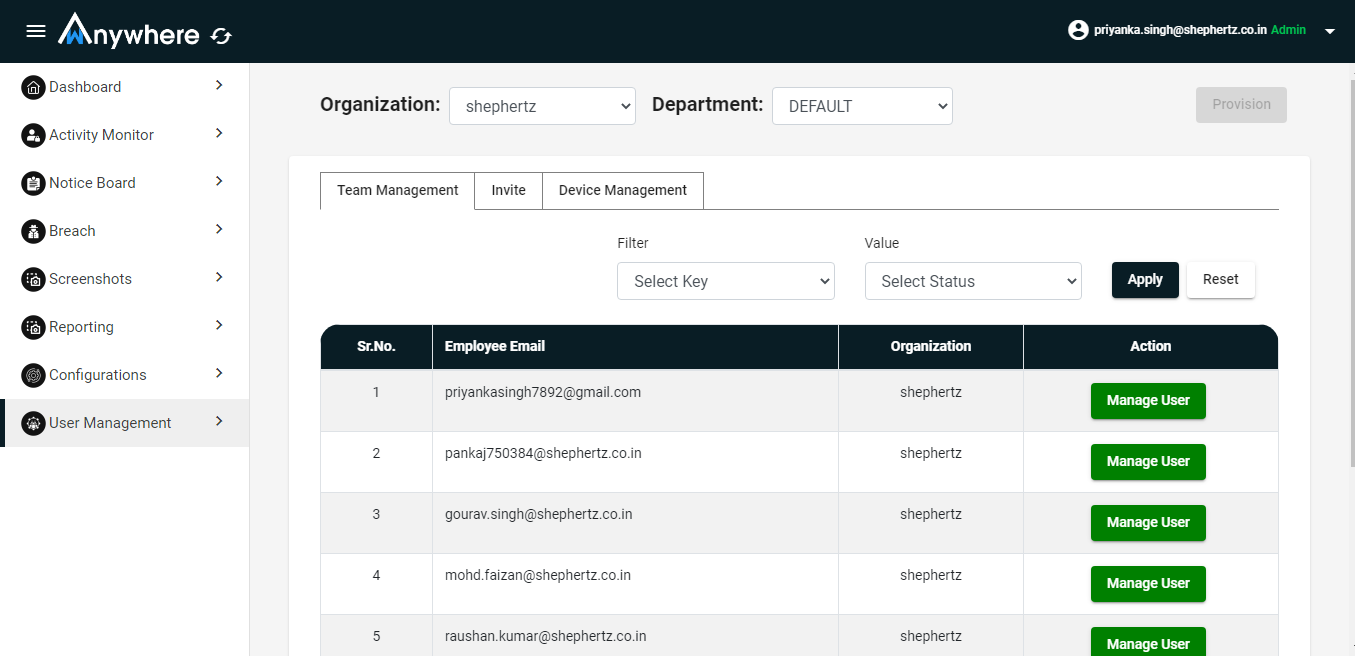
- Click manage user
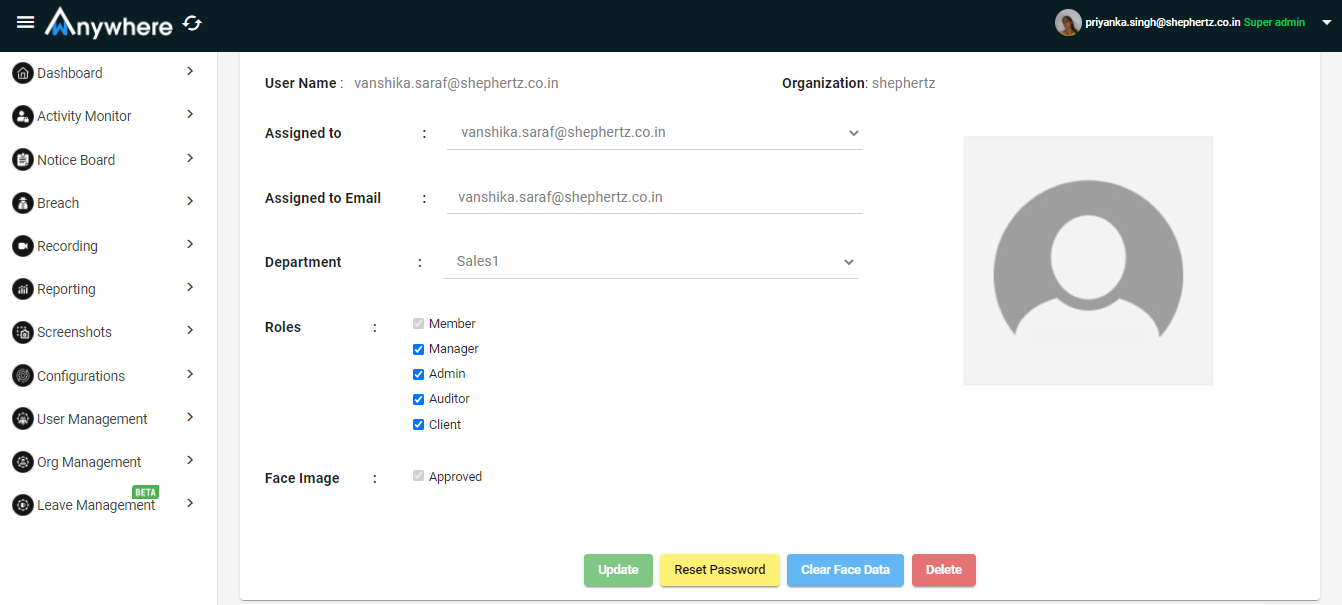
- You can change the parameter like assigned to, department, role and approval for the face image
- Click on update button
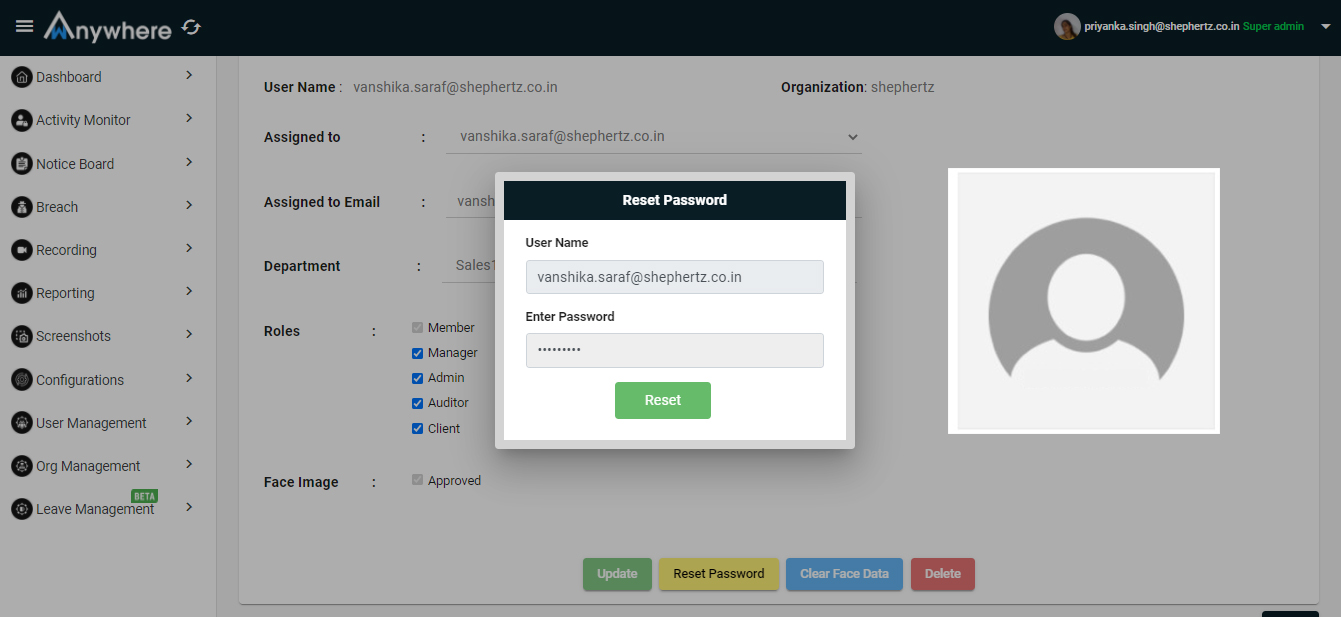
Reset password
- Superadmin and admin can reset/update the password.
- Enter email address
- Enter password
- Click on the reset button button and it will successfully update the users password.
Clear face data
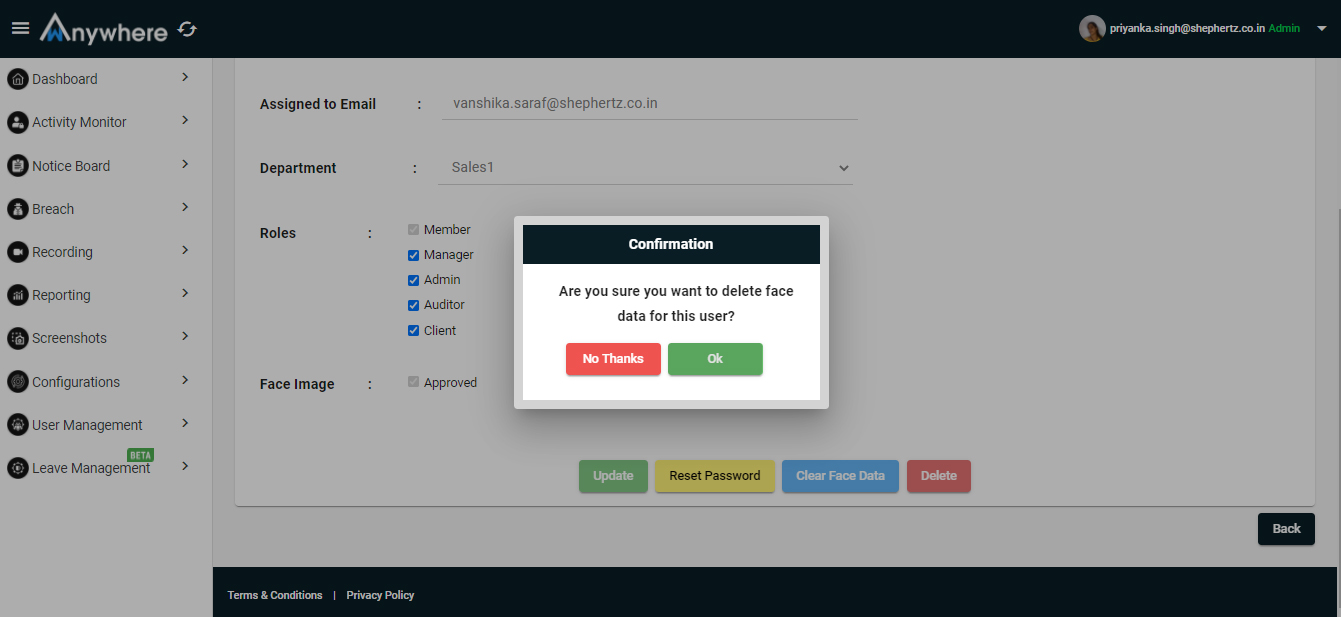
- Superadmin and admin can clear or delete the face data of the user.
- It will ask for the confirmation to clear the face data or not.
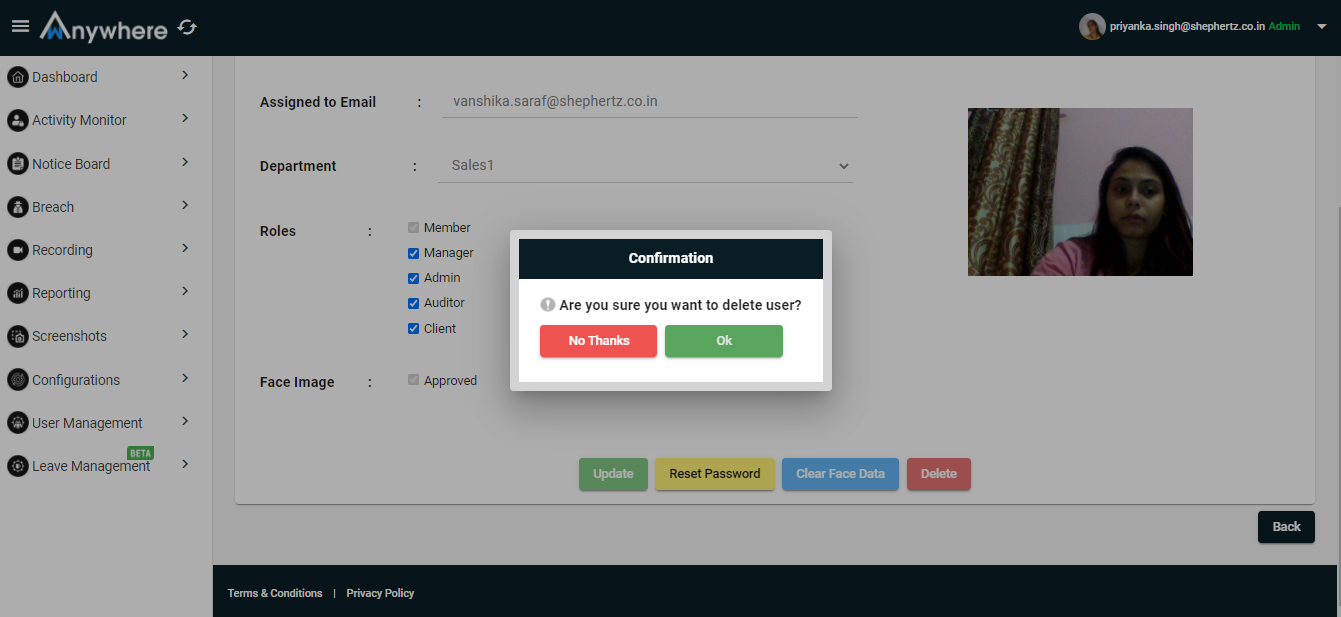
Delete
- Superadmin and admin can delete the user permanently.
- By clicking on the delete button the confirmation will be asked for deleting the user.
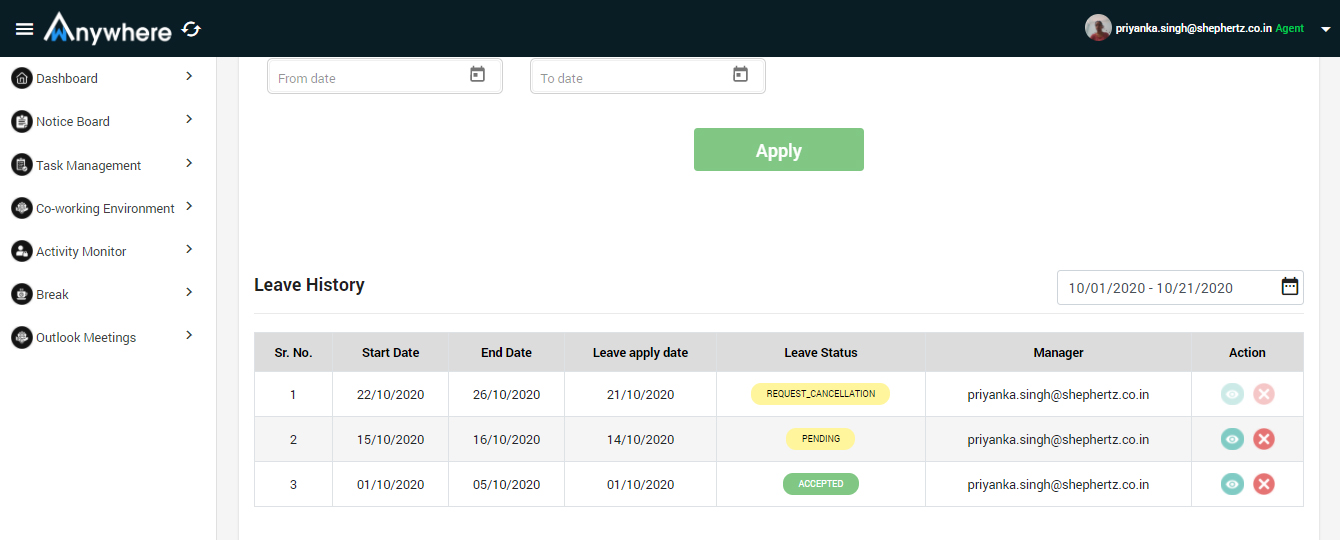
Apply leave
- Agent can apply for leave
- Agent can not apply the leave for already applied dates
- Agent is able to cancel its applied leave in case of no need
Leave history
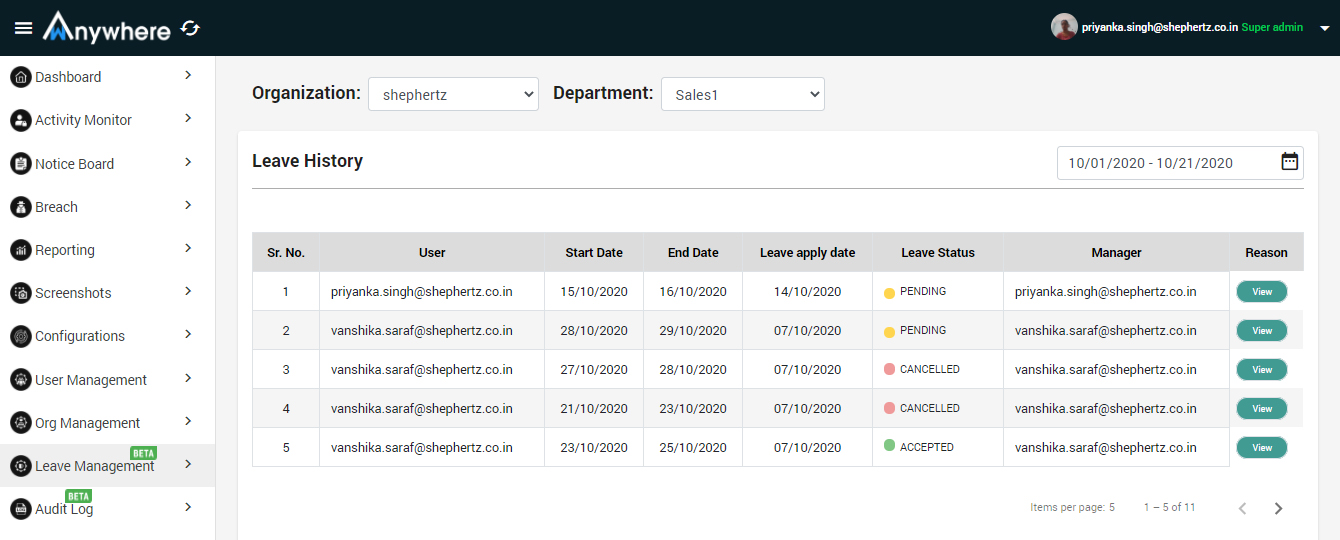
- Agent is able to see its leave history
- Agent can check the status of applied leave
- Only manager is able to approve or decline the applied leave of the agent
- Manager can see the reason for the applied leave
- Manager can see and approve or reject the raised cancellation request
- Superadmin and admin check who has applied for the leave and for what reason
- Superadmin and admin can only see the status of the applied leave by agent and also the reason for the rejection by the manager
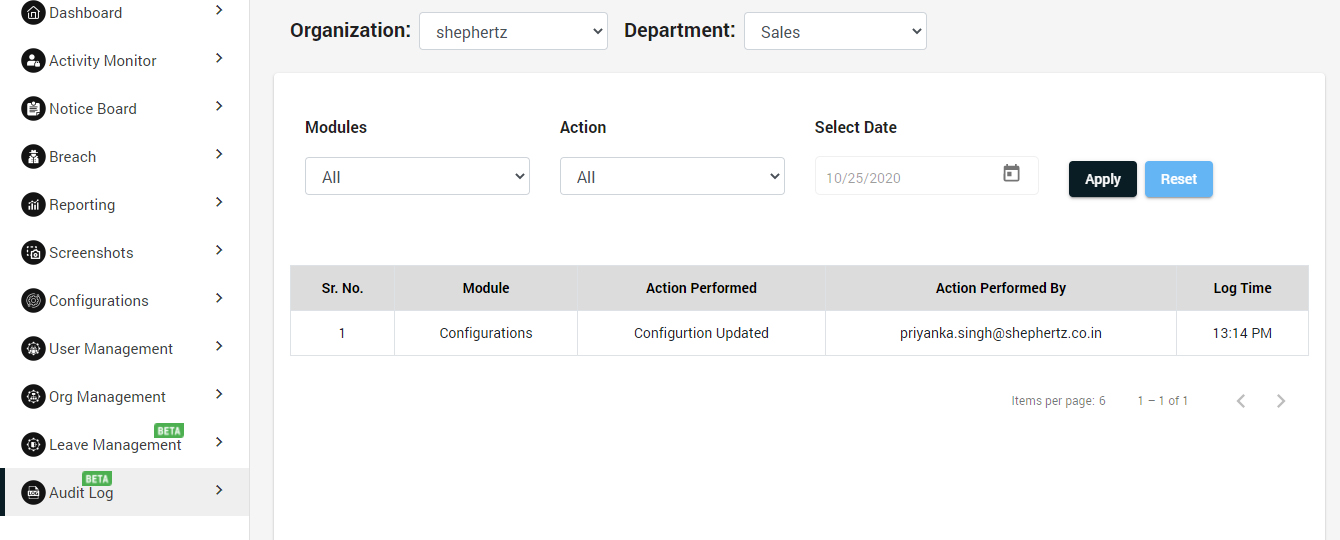
- In audit logs, the changes of activity monitor, user management, configuration, organisation management and privacy breaches modules logs will be added.
- Only superadmin and admin can see the audit logs
- Superadmin and admin can check by who and when the changes were made
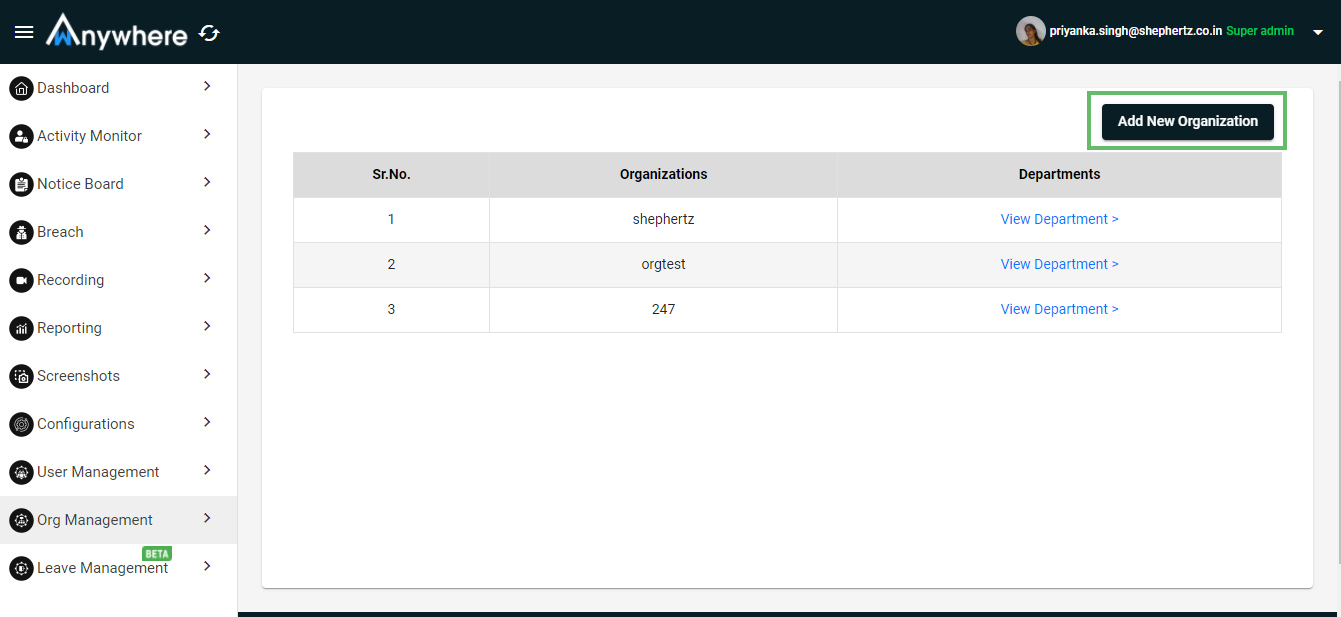
The superadmin can manage all the organization. Superadmin can create multiple department,admin and auditor.
- Login
- Select org management menu
- Add new organization: Click on add new organization button and enter organization name and click on add button
- Only superadmin will be able to add new organisation.
Add Department
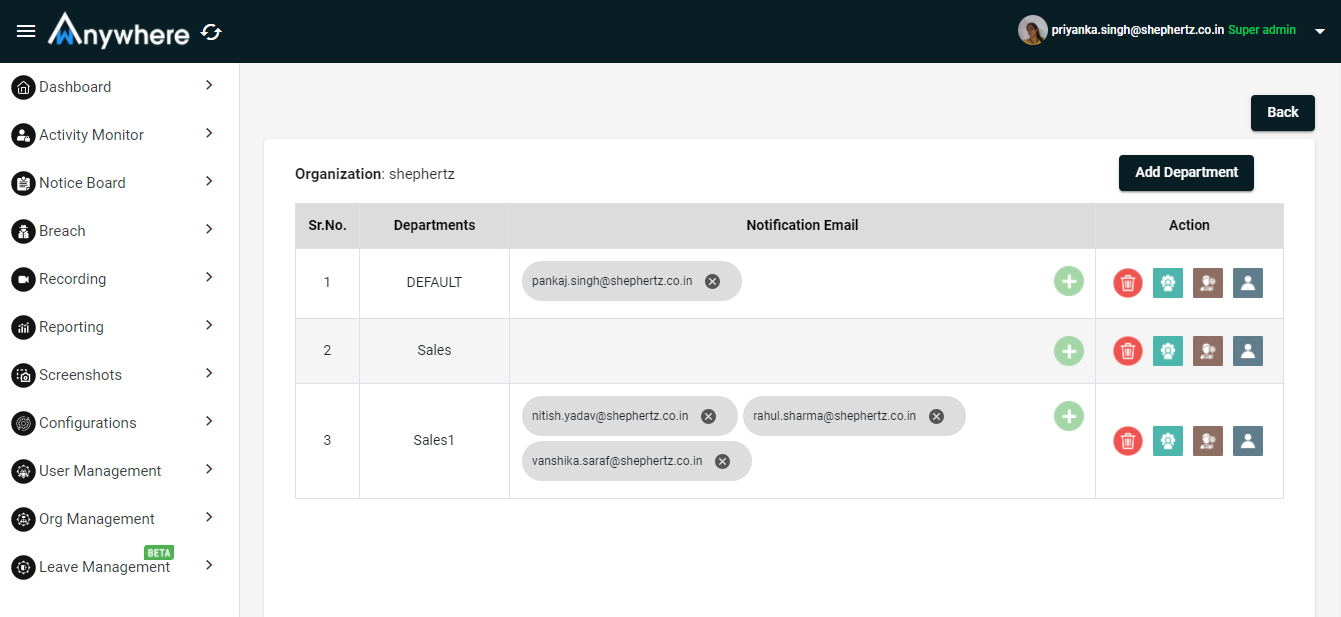
- To create new department - Click on add department button and enter department name and click on add button.
- Only superadmin will be able to add new department.
- Superadmin will be able to delete the particular department.
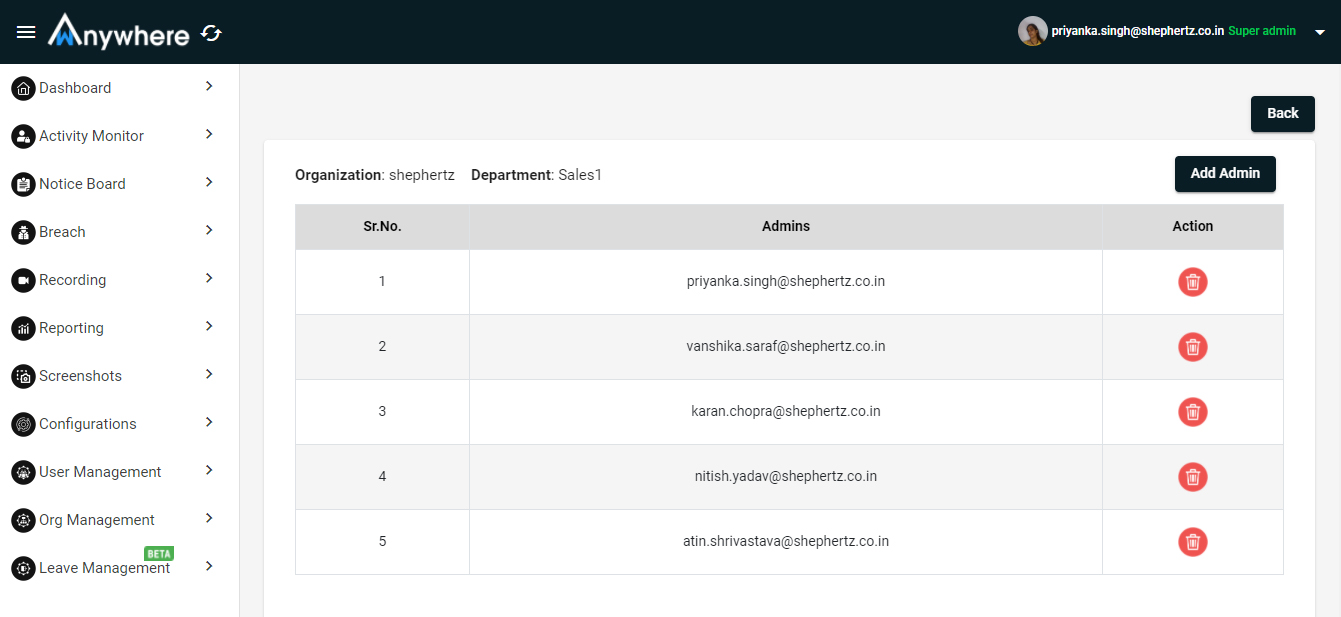
Add Admin
- Click on add admin button and enter admin name and click on add button.
- Only superadmin will be able to add admin of the department.
- Superadmin will be able to delete the admin from the particular department.
Add Auditor
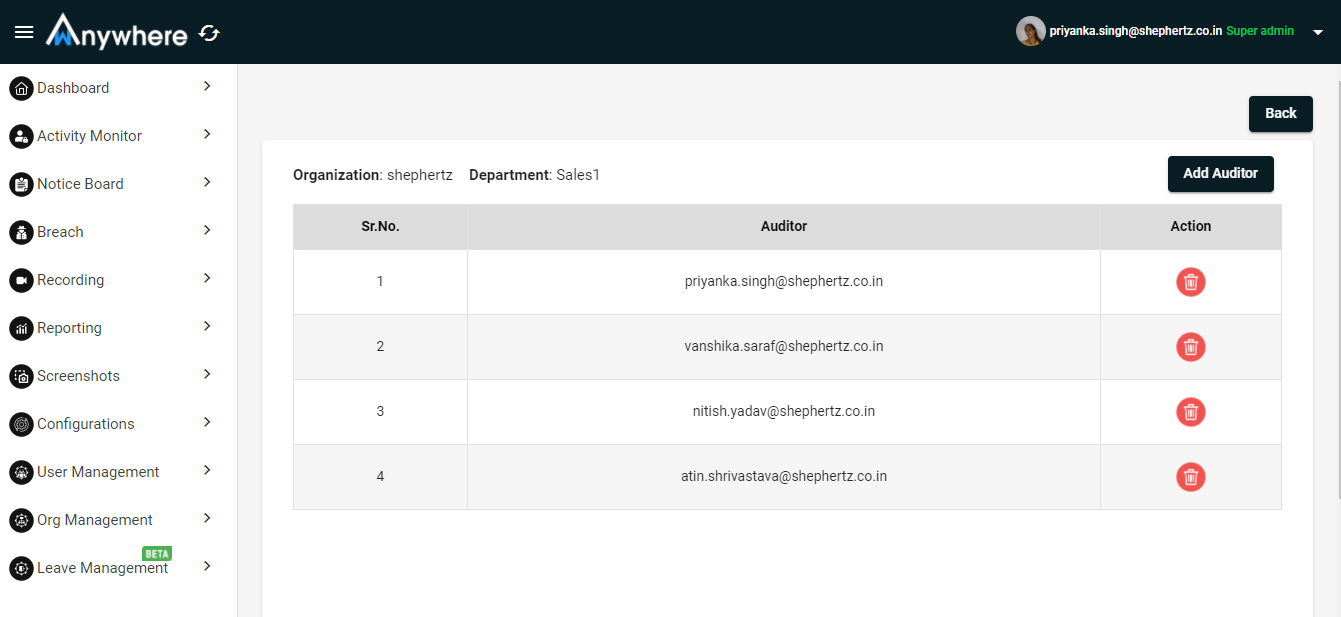
- Click on add auditor button and enter auditor name and click on add button.
- Only superadmin will be able to add auditor of the department.
- Superadmin will be able to delete the auditor from the particular department
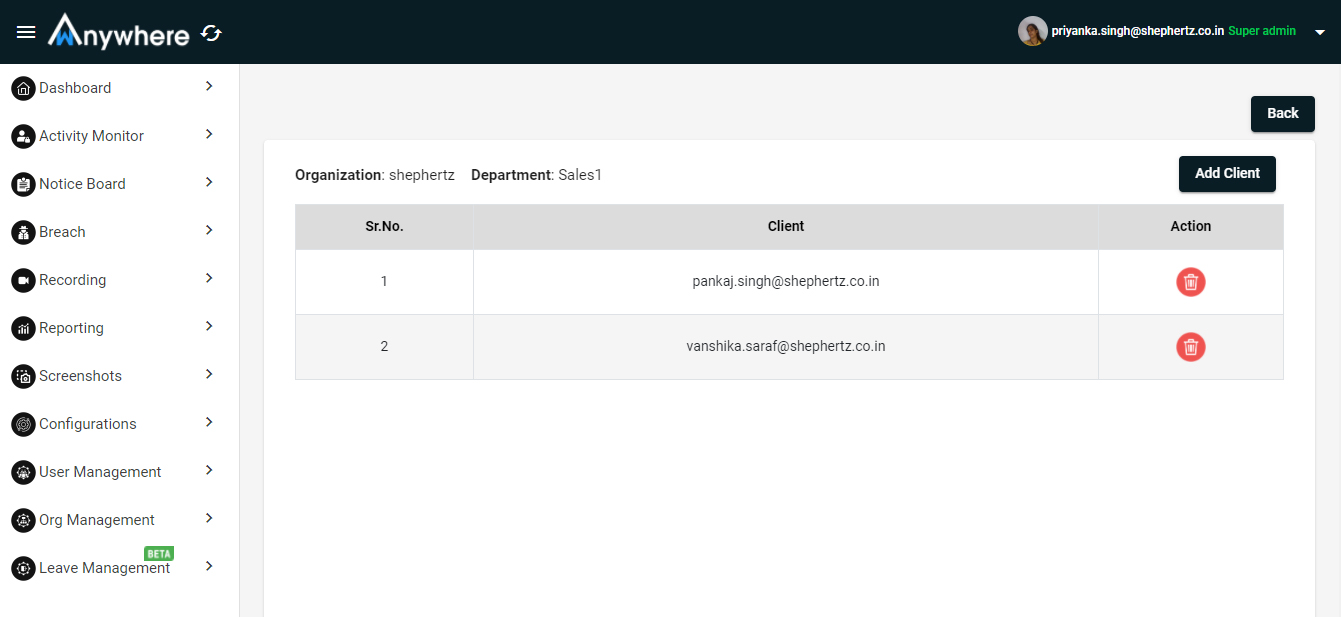
Add Client
- Click on add client button and enter client name and click on add button.
- Only superadmin will be able to add client of the department.
- Superadmin will be able to delete the client from the particular department.
Add Notification Email
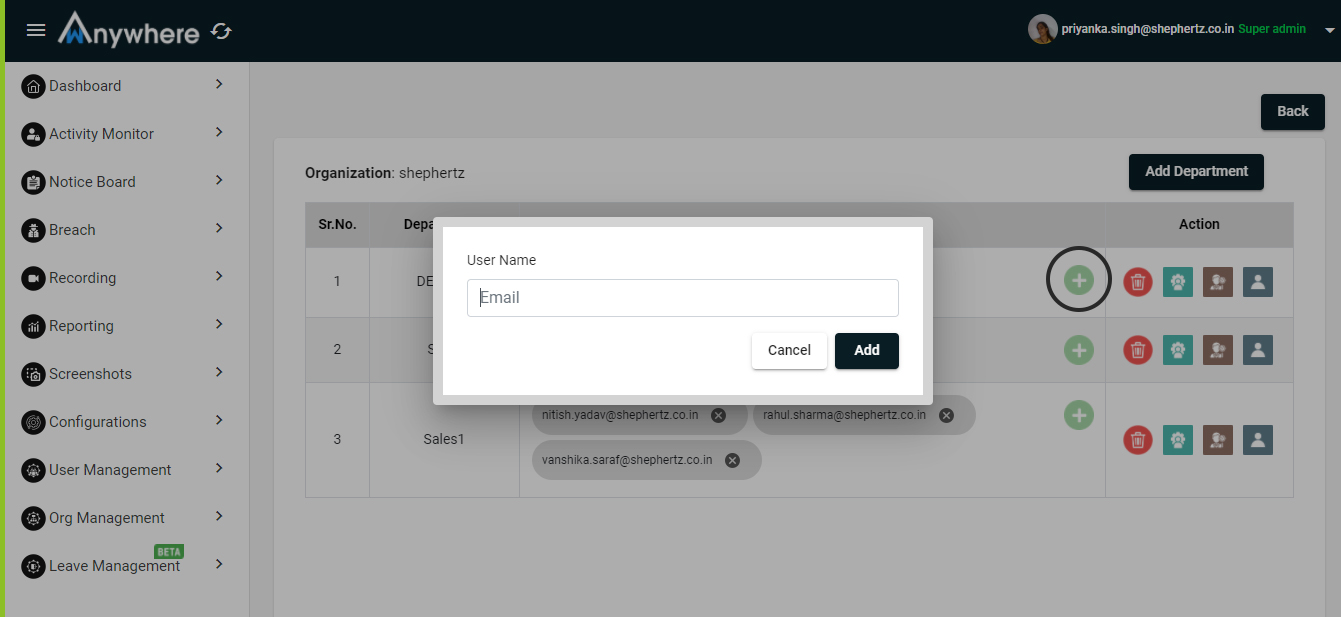
- Click on plus (+) button and enter email of the user and click on add button.
- Only superadmin will be able to add email for the notification of the department.
- Superadmin will be able to delete the email of the user for notification from the particular department.
Tasks
- Manager and agent can create tasks and it will be shown in tasks table
- Manager can delete/edit/view the created tasks
- Agent can select the action like completed, in progress, pending as the status of the tasks
- Agent can only delete its own created tasks
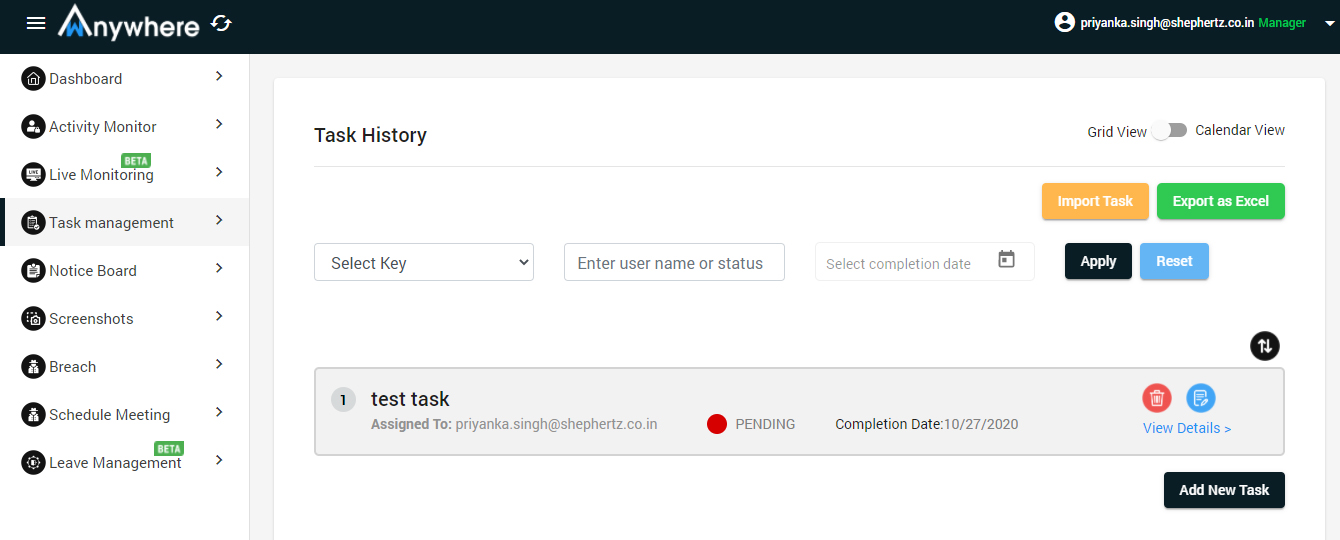
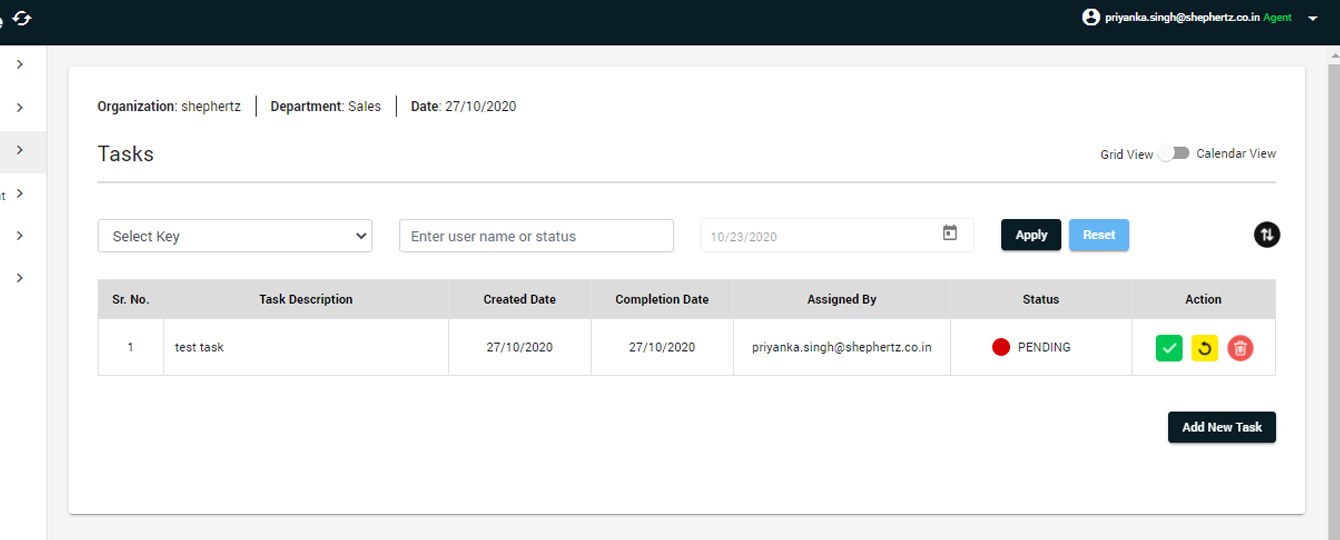
- Agent can also see its tasks calendar wise from the calendar view
- Manager can check the status of the assigned tasks from the task table
- Manager can export all the tasks into the excel sheet
- Manager can assign the tasks by importing the excel sheet by uploading it
Powered By ![]()
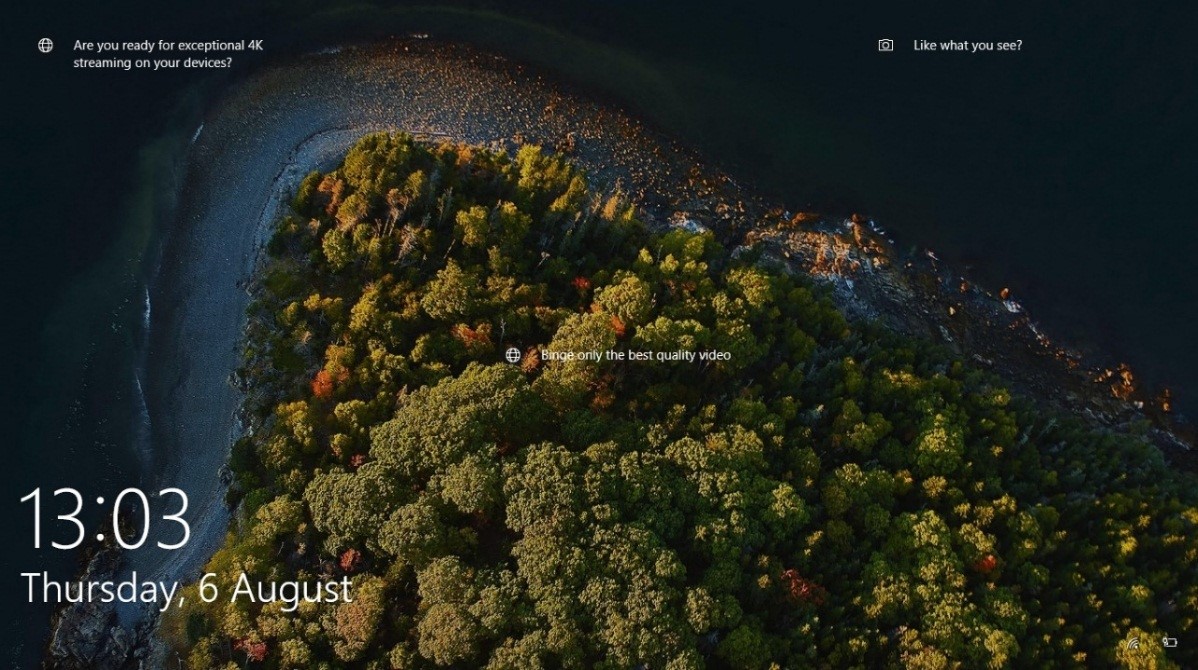
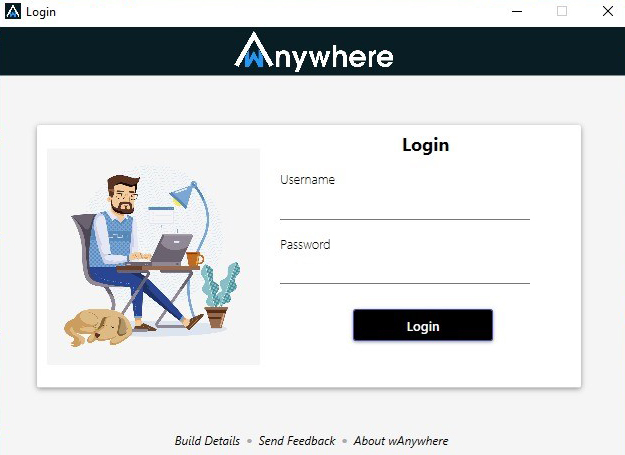
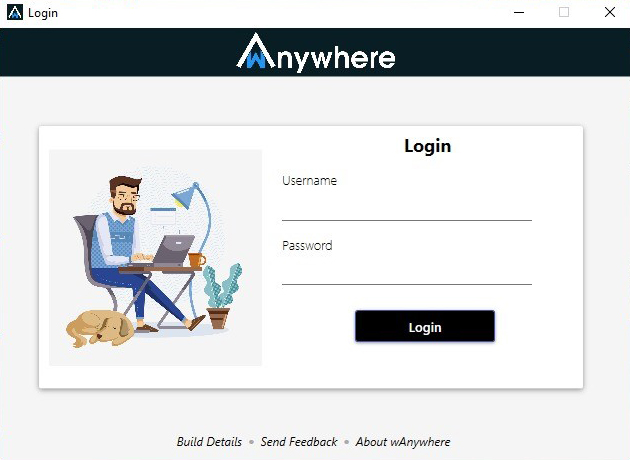
- Enter Username and password.
- Click on login button.

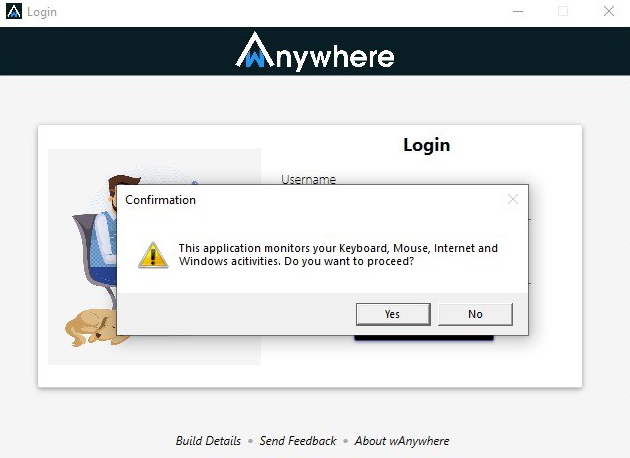
- After clicking on the login button popup alert will show to ask the permission of monitoring user system .
- Email will send with credential on your registered email Id
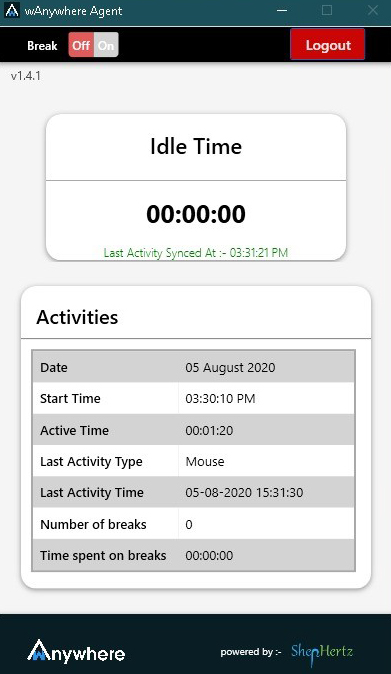
After login into the application, all the mouse, keyboard, idle time, open application and website browsing will start to be monitored based on configuration setting.
- User can take a break by clicking on the top left corner Break button.
- After clicking on break button, break time will be start and user system will lock.
- Once user will enter the password user system will get open and break time will stop.

NOT AT DESK
- The user system will blackout/lockout screen based on configuration setting.
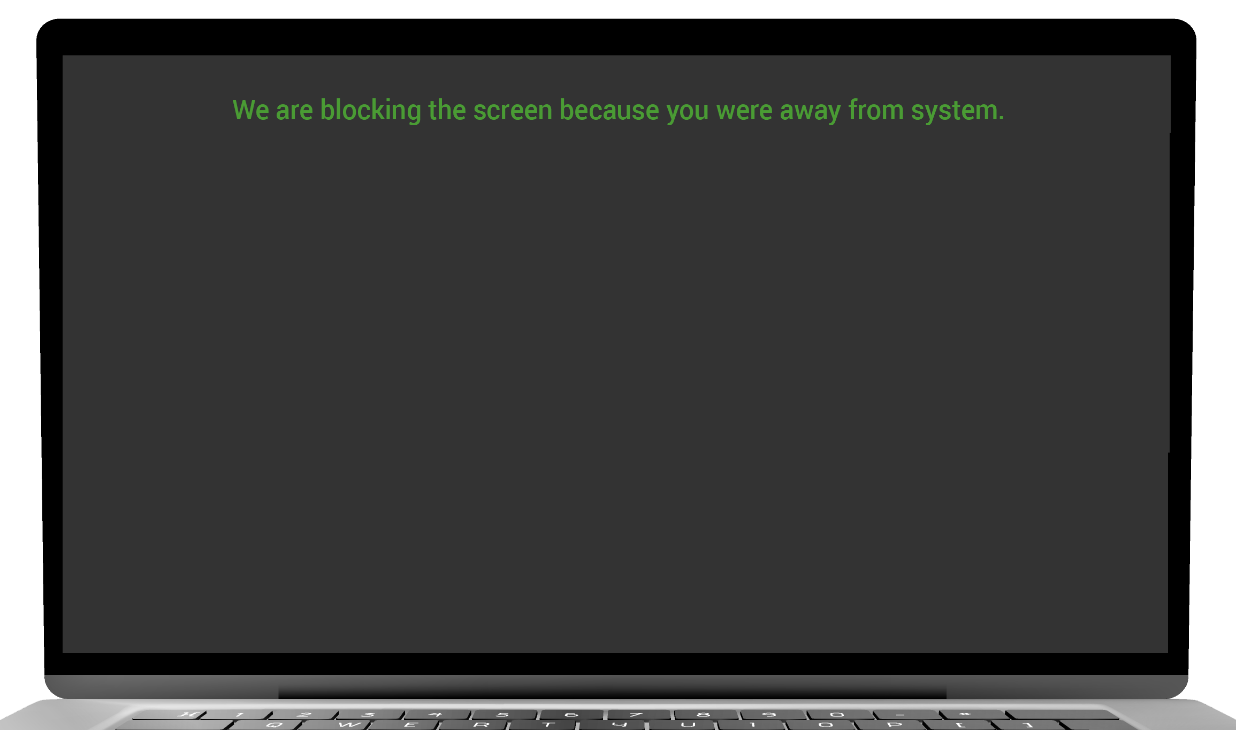
- If the screen is blackout, then perform mouse movement to resume your activity.
- If the screen is lockout then enter the password to resume your activity.
MOBILE DETECTED
- The user system will blackout/lockout screen based on configuration setting.
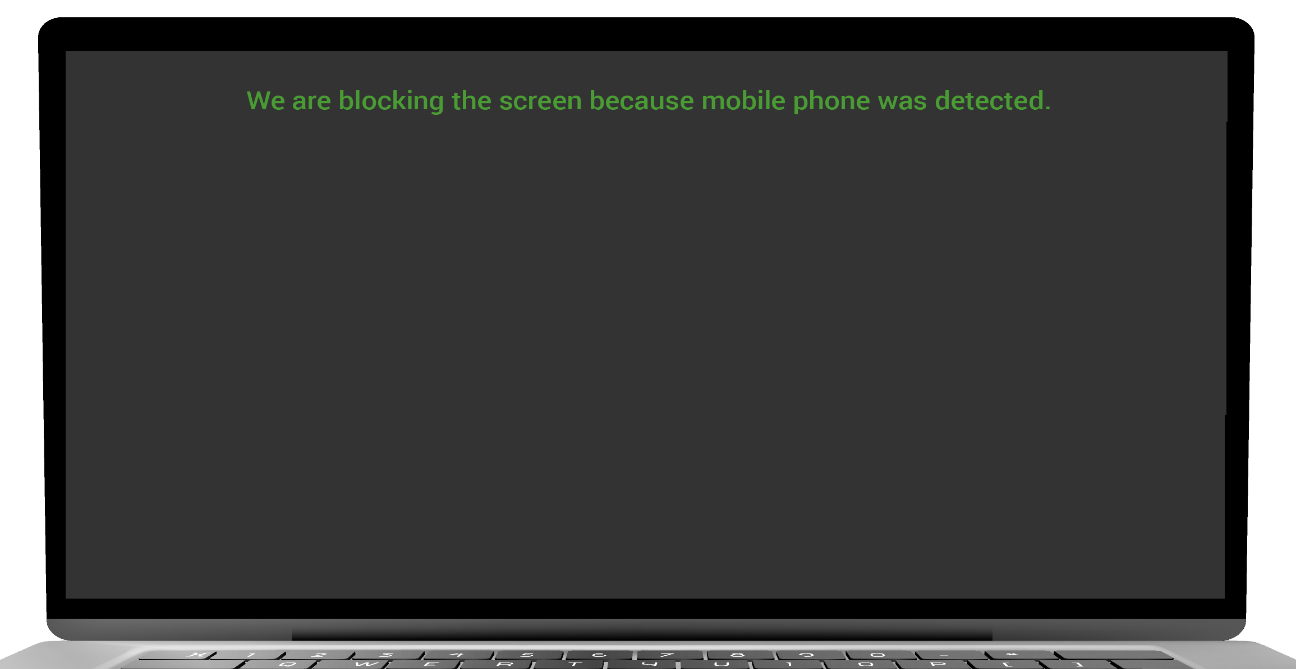
- If the screen is blackout, then perform mouse movement to resume your activity.
- If the screen is lockout then enter the password to resume your activity.
MULTIPLE PERSONS DETECTED
- The user system will blackout/lockout screen based on configuration setting.
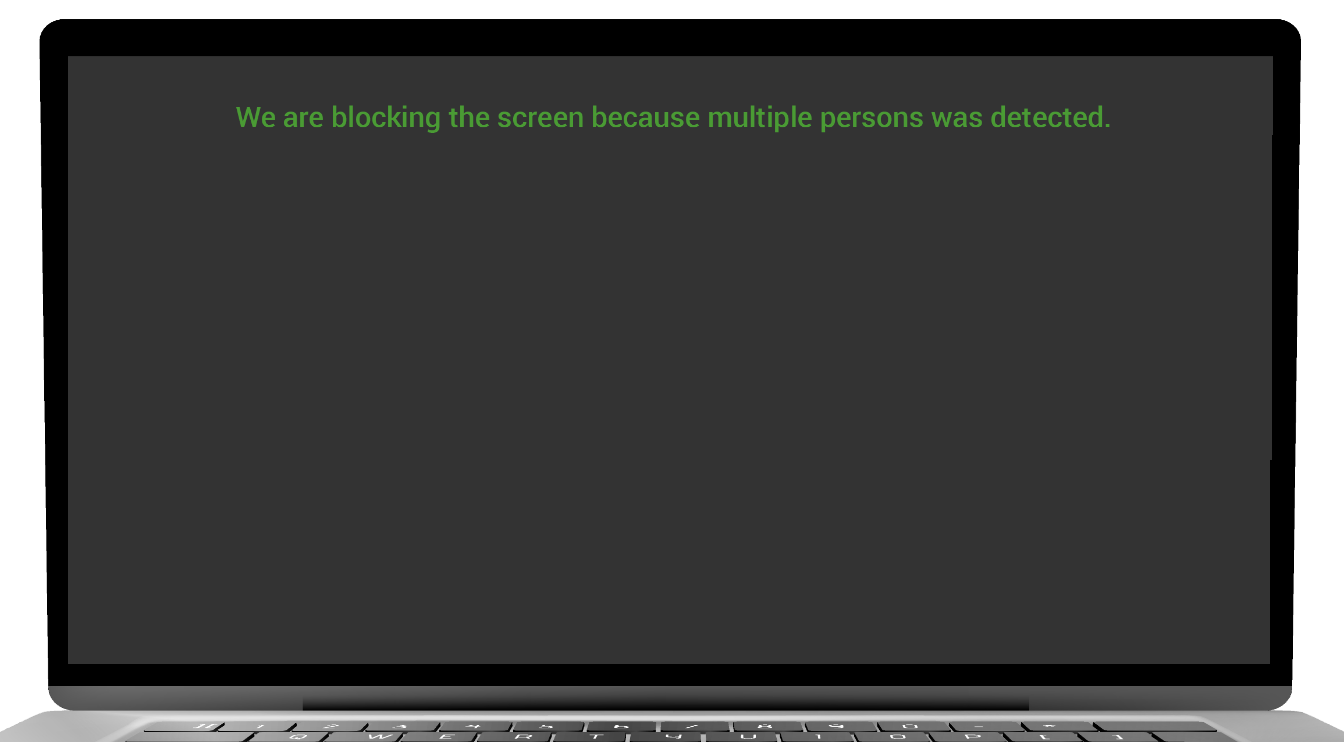
- If the screen is blackout, then perform mouse movement to resume your activity.
- If the screen is lockout then enter the password to resume your activity.
UNKNOWN PERSON DETECTED
- The user system will blackout/lockout screen based on configuration setting.
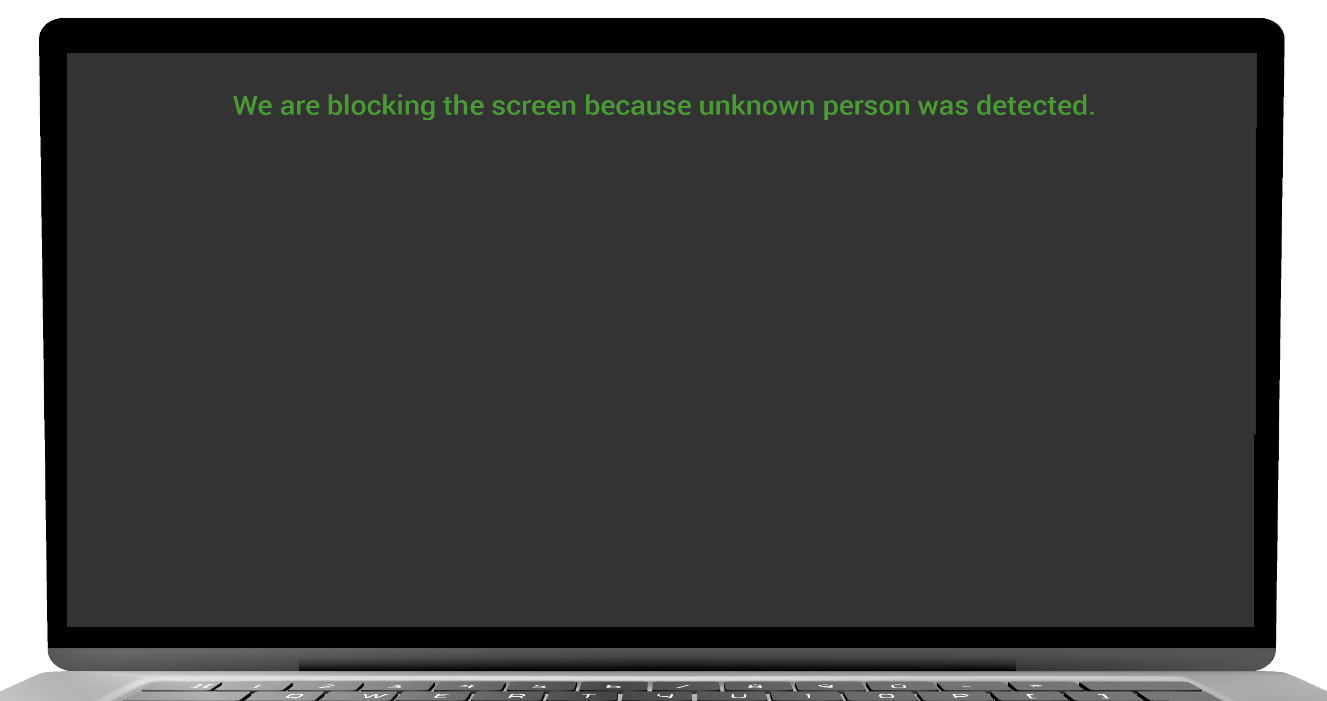
- If the screen is blackout, then perform mouse movement to resume your activity.
- If the screen is lockout then enter the password to resume your activity.
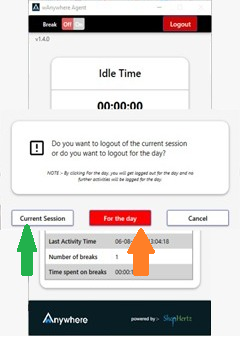
- Click on the top right corner logout button.
-
There are two type of logout:
- Current session- After clicking on the Current session logout user can again login into the application on the same day.
- For the Day- After clicking on the For the Day logout, user cannot login again on the same day and it will consider final logout.
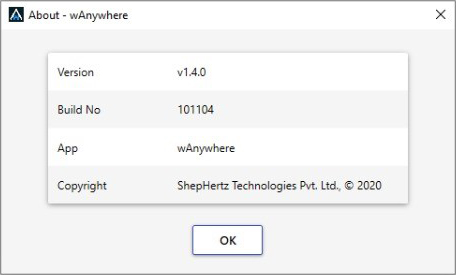
- Click on the build detail link on the home screen of the agent application.
- View build detail and click on OK button.
- Click on the send Feedback link on the home screen of the agent application.
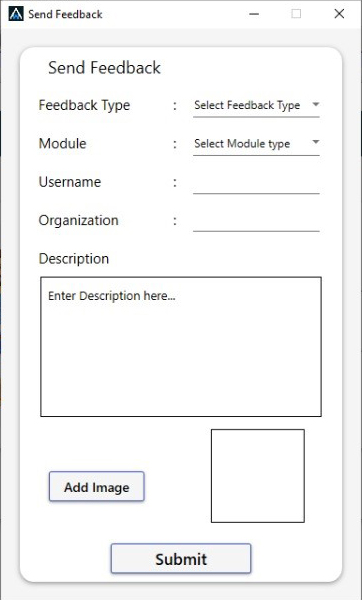
- Feel all the parameter of the below form and click on the submit button.
Powered By ![]()